
未为PPT中的图表设置数据标签属性
未为PPT中的图表设置数据标签属性
提问于 2021-12-21 05:48:08
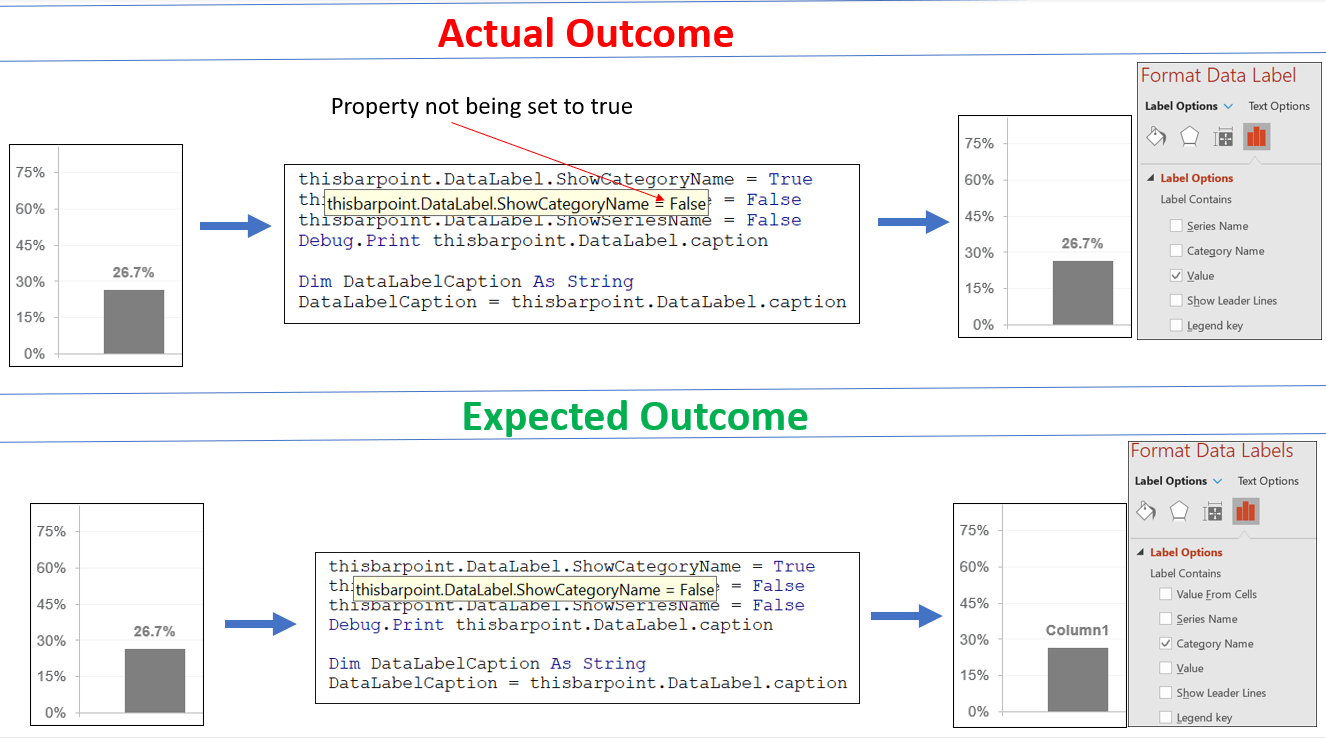
我试图使用此代码段设置数据点的数据标签属性,但由于某些原因,这些属性没有按预期设置。为了更清晰起见,请看图。
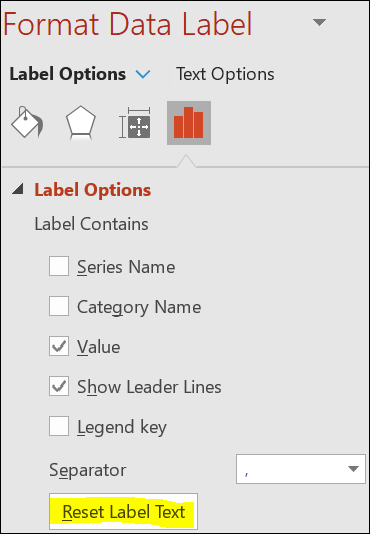
解决方法可能是使用Reset label Text (参见Pic -2),从而强制数据标签更新set属性。但我找不到与之相当的vba。帮助。
 'This is happening inside a loop

 Dim thisbarpoint As Point
 Set thisbarpoint = thischart.FullSeriesCollection(ibar).Points(jbar)

 thisbarpoint.DataLabel.ShowCategoryName = True
 thisbarpoint.DataLabel.ShowValue = False
 thisbarpoint.DataLabel.ShowSeriesName = False

 Debug.Print thisbarpoint.DataLabel.caption
 Dim DataLabelCaption As String
 DataLabelCaption = thisbarpoint.DataLabel.caption
 Debug.Print DataLabelCaption 'This gives the value as 26.7%
PIC-1:
PIC-2:
回答 1
Stack Overflow用户
发布于 2021-12-21 07:01:33
这对我来说很好:
Dim cht As Chart, s As Series

Set cht = ActivePresentation.Slides(1).Shapes(1).Chart
Set s = cht.SeriesCollection(1)

Debug.Print s.HasDataLabels 'False

s.HasDataLabels = True
With s.DataLabels
    .ShowCategoryName = True
    .ShowValue = False
    .ShowSeriesName = False
End With
我们无法知道您的文件是否已损坏,或者您未包括的代码中是否存在问题。
页面原文内容由Stack Overflow提供。腾讯云小微IT领域专用引擎提供翻译支持
原文链接:
https://stackoverflow.com/questions/70431154
复制相关文章
相似问题
腾讯云开发者

Copyright © 2013 - 2026 Tencent Cloud. All Rights Reserved. 腾讯云 版权所有
深圳市腾讯计算机系统有限公司 ICP备案/许可证号:粤B2-20090059 ![]() 粤公网安备44030502008569号
粤公网安备44030502008569号
腾讯云计算(北京)有限责任公司 京ICP证150476号 | 京ICP备11018762号