
Python的PCA :特征向量不是正交的
我正在用Python进行主成分分析(PCA)。出于理解力的考虑,我想自己实施它。为此,我根据给定的协方差矩阵创建随机数据,以便处理不同的值和主成分的行为。所以这个脚本只是为了理解和澄清PCA。
我的理解是,主成分(即协方差矩阵的特征向量)总是相互正交的。这也是维基百科的图片:
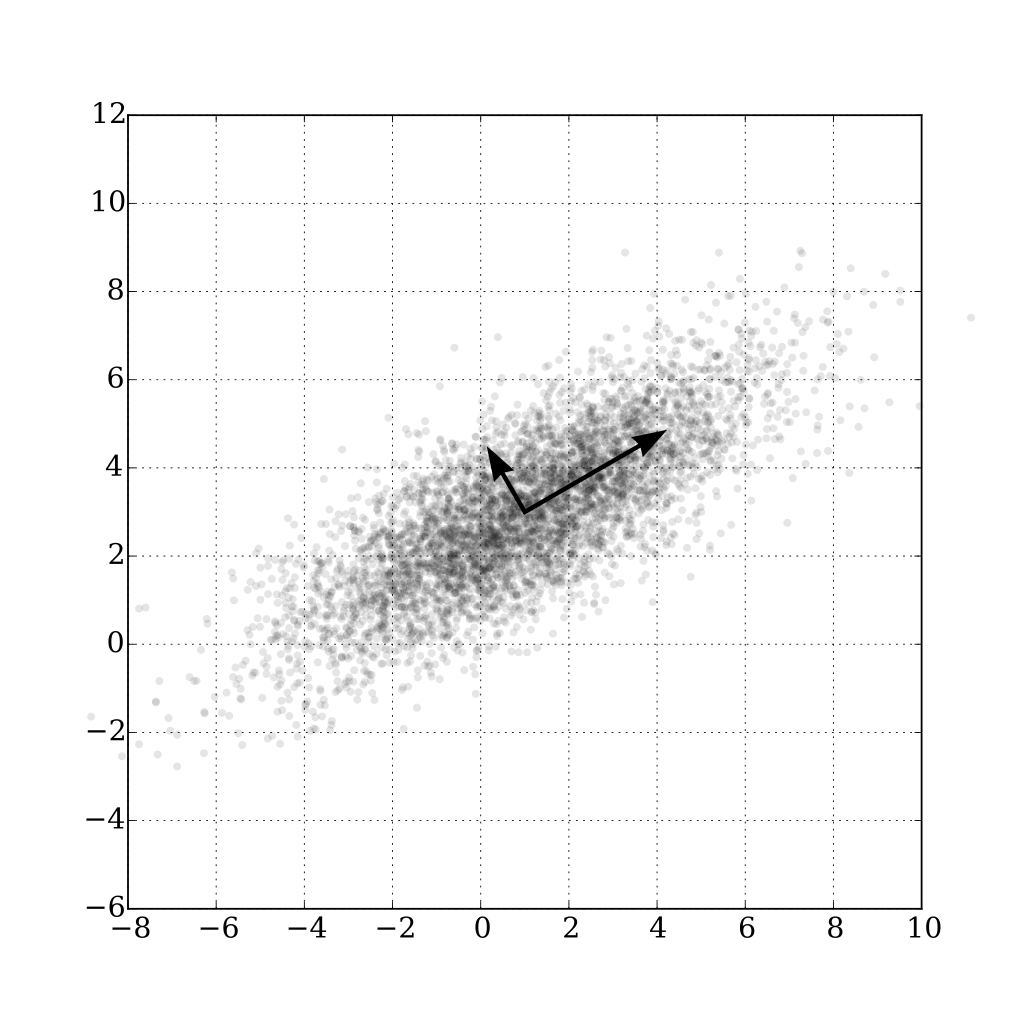
维基百科图片的描述(来源):
多元高斯分布的主成分分析以(1,3)为中心,在( 0.878,0.478 )方向的标准偏差为3,在正交方向上的标准差为1。所示的向量是由相应特征值的平方根标度的(对称的,正半定的)协方差矩阵的单位特征向量。就像在一维情况下一样,平方根被取下来,因为标准差比方差更容易可视化。
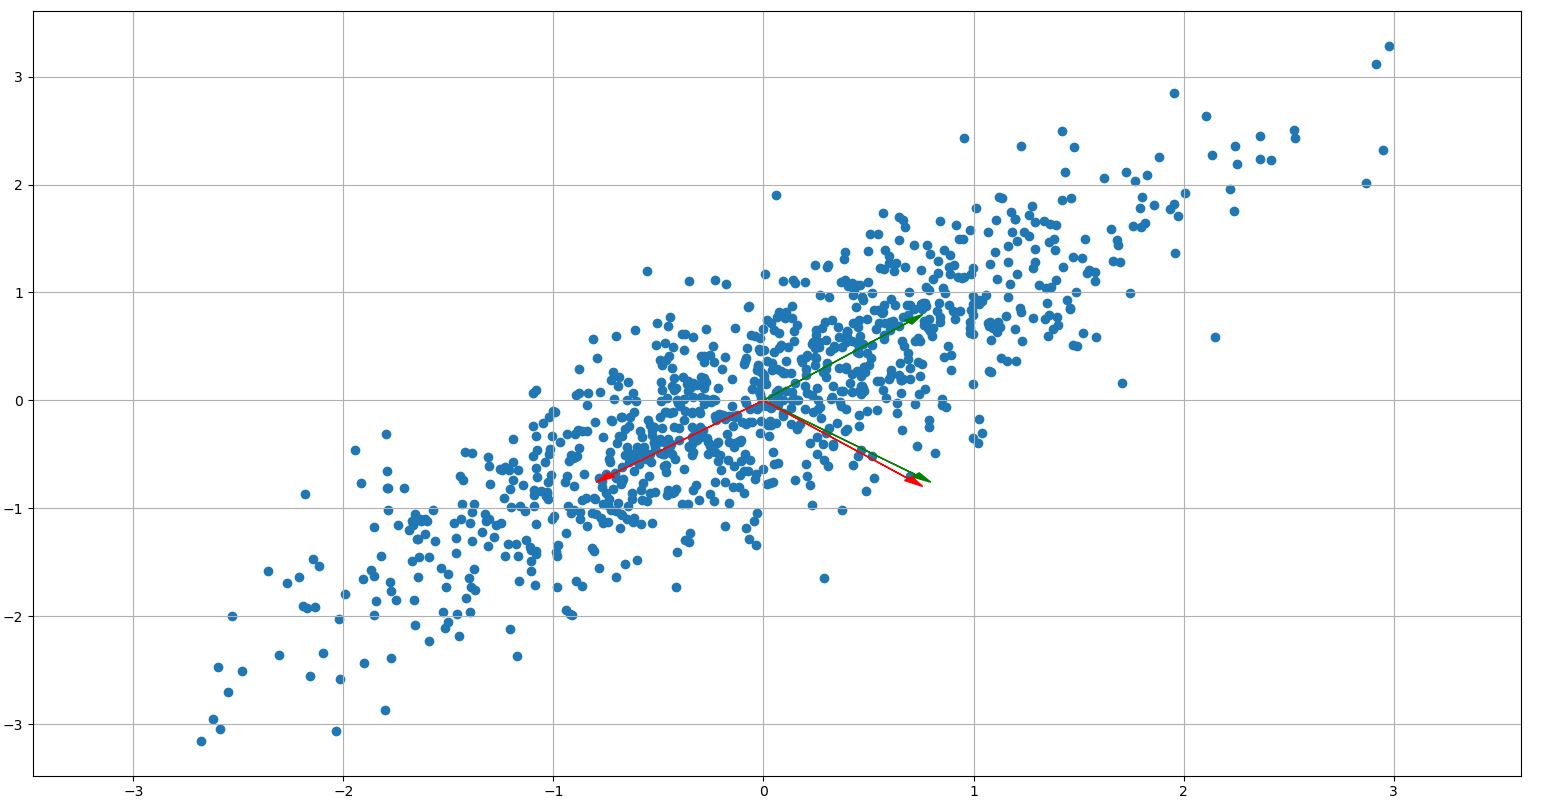
所以我认为,对于我的情况,如果我画出我从随机数据中得到的特征向量,也是正交的。但事实并非如此。他们的方向总是大致不同的。60度,而不是我所期望的90度。如果我使用sklearn库中的PCA,也会发生这种情况。请看下面的图片,红色是学习PCA的特征向量,绿色是我自己代码中的特征向量。
我的Python脚本:
from matplotlib import pyplot as plt
import numpy as np
from sklearn.decomposition import PCA


def normalize(data: np.array, mean=None, std=None):
    """
    Normalize a pandas dataframe with respect to their stochastical moment. If mean and/or std is not passed they are
    calculated beforeheand.
    :param data:    Data to be normalized
    :param mean:    A mean value (optional)
    :param std:     A standard deviation (optional)
    :return:        normalized dataframe, mean value(s), standard deviation(s)
    """
    if mean is None:
        mean = data.mean(axis=0).reshape(1, -1)
    if std is None:
        std = data.std(axis=0).reshape(1, -1)

    res = data - mean / std

    return res, mean, std


# Press the green button in the gutter to run the script.
if __name__ == '__main__':
    datacount = 1000

    # create data based on given covariance matrix
    cov = np.array([[1, 0.85], [0.85, 1]])
    rand1 = np.random.multivariate_normal([1, 3], cov, datacount)

    # normalize, calculate covariance matrix and its eigenvectors and eigenvalues
    rand1, mean, std = normalize(rand1)
    cov = np.cov(rand1.T)
    eig_values, eig_vectors = np.linalg.eig(cov)

    # sort eig_values by importance and use this to also sort the vectors
    idx = np.argsort(eig_values, axis=0)[::-1]
    sorted_eig_vectors = eig_vectors[:, idx]

    # plot data
    plt.figure()
    plt.scatter(rand1[:, 0], rand1[:, 1])
    # set both axis limits to the maximum/minimum of the axis scalesv
    ax = plt.gca()
    xlimits = np.array(ax.get_xlim())
    ylimits = np.array(ax.get_ylim())
    axmax = np.max([np.max(xlimits), np.max(ylimits)])
    axmin = np.min([np.min(xlimits), np.min(ylimits)])
    ax.set_xlim([axmin, axmax])
    ax.set_ylim([axmin, axmax])

    # use PCA from sklearn for comparison
    pca = PCA(n_components=2)
    pca = pca.fit(rand1)

    # Plot the eigenvectors
    # Beware! Eigenvectors are oriented in rows in sklearn PCA and column-oriented in np.linalg.eig()!
    for i in range(2):
        plt.arrow(0, 0, pca.components_[0, i], pca.components_[1, i], color="g",
                  head_width=0.05, head_length=0.1)

    for i in range(2):
        plt.arrow(0, 0, eig_vectors[i, 0], eig_vectors[i, 1], color="r",
                  head_width=0.05, head_length=0.1)

    # plt.annotate(text='', xy=(1, 1), xytext=(0, 0), arrowprops=dict(arrowstyle='<->'))
    plt.grid()
    plt.figure()

    # Transform data to new subspace
    eig_scores = np.dot(rand1, sorted_eig_vectors[:, :2]).T

    # plot PCAs in subspace
    plt.scatter(eig_scores[0], eig_scores[1])

    # set both axis limits to the maximum/minimum of the axis scales
    ax = plt.gca()
    xlimits = np.array(ax.get_xlim())
    ylimits = np.array(ax.get_ylim())
    axmax = np.max([np.max(xlimits), np.max(ylimits)])
    axmin = np.min([np.min(xlimits), np.min(ylimits)])
    ax.set_xlim([axmin, axmax])
    ax.set_ylim([axmin, axmax])
    plt.grid()
    plt.show()

    # Are Eigenvectors orthogonal?
    print(np.dot(eig_vectors[:, 0], eig_vectors[:, 1]) == 0)    # yields True
    print(np.dot(pca.components_[0, :], pca.components_[1, :]) == 0)    # yields True
奇怪的是,最后两条线,我检查这两种方法的特征向量是否是正交的,总是得到真,表明向量实际上是正交的。
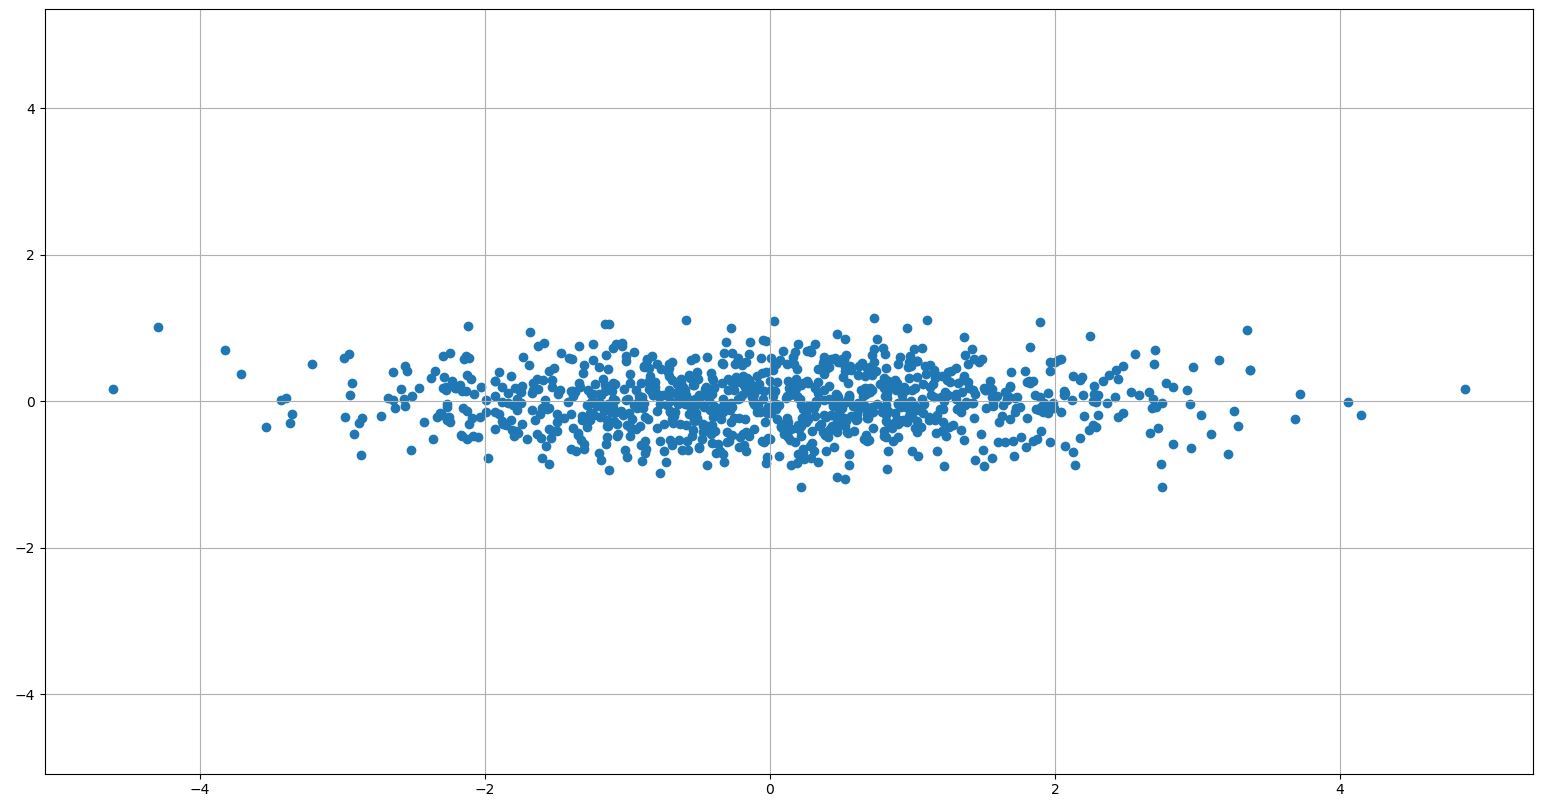
此外,将数据转换为新的子空间也很好,结果如下:
我遗漏了什么?我的期望是假的吗?或者我的Python脚本中有bug?
回答 1
Stack Overflow用户
发布于 2021-12-18 13:10:43
你检查过它们是正交的,而且它们是正交的,但在情节中,你说它们不是。矢量绘制正确吗?它们是:
array([[ 0.707934  , -0.70627859],
       [ 0.70627859,  0.707934  ]])
从数字上看似乎是这样的。
问题是,你试图测量你的显示器上的角度,在那里两个轴有不同的比例。
只需添加plt.axis('equal')
https://stackoverflow.com/questions/70403502
复制相似问题
腾讯云开发者

Copyright © 2013 - 2026 Tencent Cloud. All Rights Reserved. 腾讯云 版权所有
深圳市腾讯计算机系统有限公司 ICP备案/许可证号:粤B2-20090059 ![]() 粤公网安备44030502008569号
粤公网安备44030502008569号
腾讯云计算(北京)有限责任公司 京ICP证150476号 | 京ICP备11018762号