
R中时间序列图的传说
R中时间序列图的传说
提问于 2021-12-17 00:42:45
我如何在下面的情节中添加传说?
library(quantmod)
library(PerformanceAnalytics)
library(imputeTS)
library(PortfolioAnalytics)

tickers <- c("FB", "AAPL", "AMZN", "NFLX")
weights <- c(.25, .25, .25, .25)

portfolioPrices <- NULL
for (Ticker in tickers)
  portfolioPrices <- cbind(portfolioPrices,
                           getSymbols.yahoo(Ticker, from="2016-01-01", periodicity = "daily", auto.assign=FALSE)[,4])

plot(portfolioPrices, legend = tickers)回答 1
Stack Overflow用户
回答已采纳
发布于 2021-12-17 02:53:57
如果将portfolioPrices转换为dataframe,然后分别添加每一行,则可以添加一个图例。
下面的代码没有创建最好看的情节/图例,但您可以通过使用图例/绘图参数来改进它。
此外,可以使用循环而不是硬编码来添加行。
library(quantmod)
library(PerformanceAnalytics)
library(imputeTS)
library(PortfolioAnalytics)
tickers <- c("FB", "AAPL", "AMZN", "NFLX")
weights <- c(.25, .25, .25, .25)
portfolioPrices <- NULL
for (Ticker in tickers)
portfolioPrices <- cbind(
portfolioPrices,
getSymbols.yahoo(
Ticker,
from = "2016-01-01",
periodicity = "daily",
auto.assign = FALSE
)[, 4]
)
portfolioPrices <- data.frame(portfolioPrices)
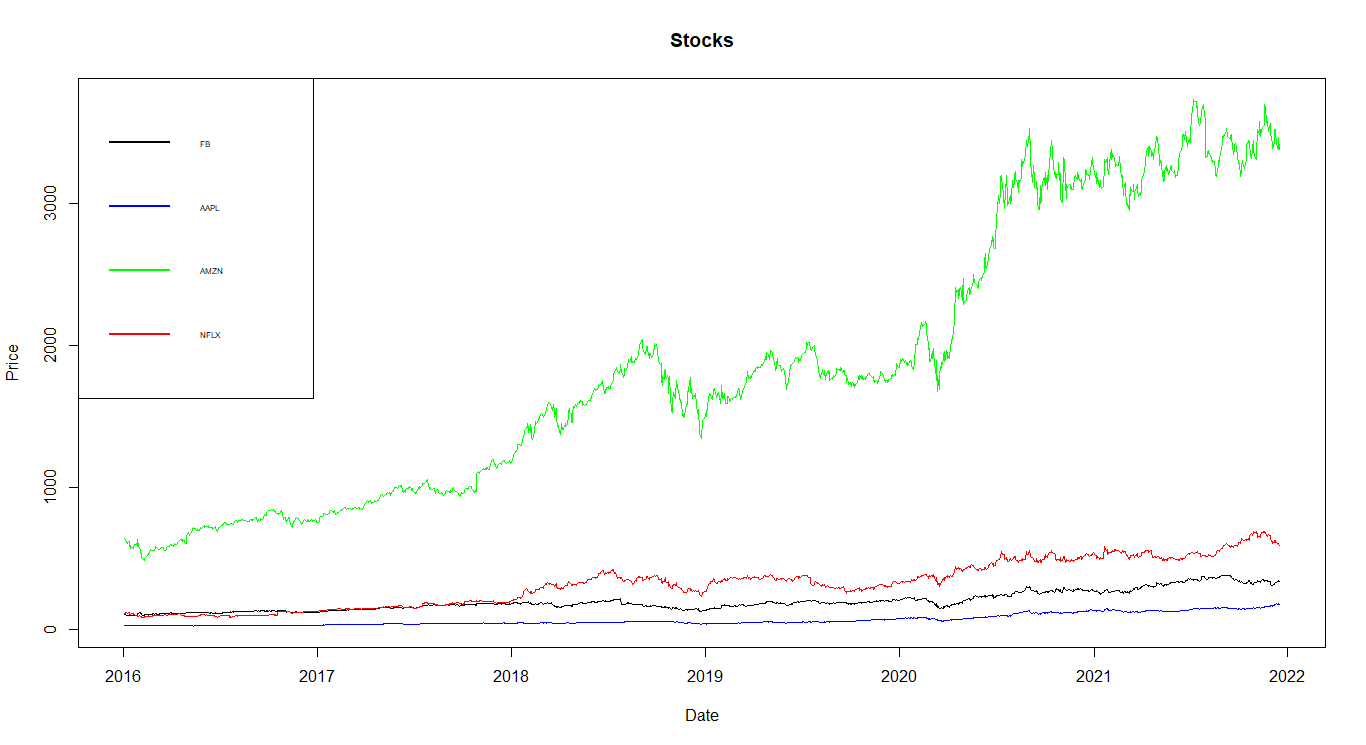
plot(
x = as.Date(rownames(portfolioPrices)),
portfolioPrices$FB.Close,
col = "black",
type = "l",
ylim = c(min(portfolioPrices), max(portfolioPrices)),
main = "Stocks",
xlab = "Date",
ylab = "Price"
)
lines(x = as.Date(rownames(portfolioPrices)),
portfolioPrices$AAPL.Close,
col = "blue")
lines(x = as.Date(rownames(portfolioPrices)),
portfolioPrices$AMZN.Close,
col = "green")
lines(x = as.Date(rownames(portfolioPrices)),
portfolioPrices$NFLX.Close,
col = "red")
legend(
"topleft",
legend = tickers,
col = c("black", "blue", "green", "red"),
cex = 0.5,
lwd = 2
)
页面原文内容由Stack Overflow提供。腾讯云小微IT领域专用引擎提供翻译支持
原文链接:
https://stackoverflow.com/questions/70387245
复制相关文章
相似问题
腾讯云开发者

Copyright © 2013 - 2026 Tencent Cloud. All Rights Reserved. 腾讯云 版权所有
深圳市腾讯计算机系统有限公司 ICP备案/许可证号:粤B2-20090059 ![]() 粤公网安备44030502008569号
粤公网安备44030502008569号
腾讯云计算(北京)有限责任公司 京ICP证150476号 | 京ICP备11018762号