
使用函数将精确回忆曲线添加到绘图中
使用函数将精确回忆曲线添加到绘图中
提问于 2021-12-16 18:08:38
对于许多分类器,我有一个精确和召回的数据,每个分类器都有4个不同的置信阈值值:
    MODEL   CONFIDENCE_THR  PRECISION   RECALL
0   Model1  0.25    0.992647    0.950704
1   Model1  0.45    1.000000    0.929577
2   Model1  0.35    0.992537    0.936620
3   Model1  0.30    0.992593    0.943662
4   Model2  0.45    0.992647    0.950704
5   Model2  0.30    0.992647    0.950704
6   Model2  0.35    0.992647    0.950704
7   Model2  0.25    0.992701    0.957746
8   Model3  0.30    0.978417    0.957746
9   Model3  0.35    0.978102    0.943662
.
.
.
我想在JupyterLab中创建一个Matplotlib图,并为每个模型添加一个精确召回曲线。由于模型列表将来可能会发生变化,所以我希望使用Python函数来实现这一点,而不是在Matplotlib代码中硬编码模型名称。我写了这样的东西
import pandas as pd
import matplotlib.pyplot as plt
%matplotlib widget

df = pd.read_csv("results.csv")

plt.title('Precision-Recall curves')
plt.legend(loc = 'lower right')

def plot_precision_recall_curve(df, model, plt):
    df = df.loc[df['MODEL'] == model, ['MODEL', 'PRECISION', 'RECALL']]
    plt.plot(df['RECALL'], df["PRECISION"], 'b', label = model)

plot_precision_recall_curve(df, 'Model1', plt)
plt.show()
但我得到了一个空洞的情节
No artists with labels found to put in legend. Note that artists whose label start with an underscore are ignored when legend() is called with no argument.另外,请注意,在我的代码中,我试图绘制单个模型的精确召回曲线,但实际上,我想在相同的图中添加包含在dataframe中的所有模型的精确召回曲线。你能帮帮我吗?
回答 1
Stack Overflow用户
回答已采纳
发布于 2021-12-16 18:32:09
若要修复代码,请在绘制某些内容后移动plt.legend(),最好是在plt.show()之前。
plt.title('Precision-Recall curves')
plot_precision_recall_curve(df, 'Model1', plt)
plt.legend(loc = 'lower right')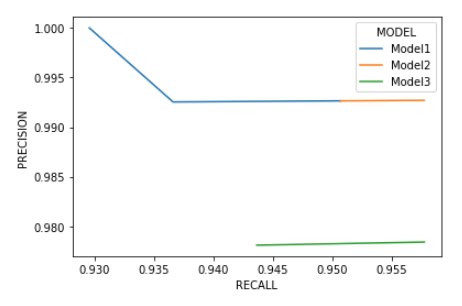
plt.show()另一方面,你对seaborn开放吗?
import seaborn as sns
sns.lineplot(data=df, x='RECALL', y='PRECISION', hue='MODEL')
输出:
页面原文内容由Stack Overflow提供。腾讯云小微IT领域专用引擎提供翻译支持
原文链接:
https://stackoverflow.com/questions/70383740
复制相关文章
相似问题
腾讯云开发者

Copyright © 2013 - 2026 Tencent Cloud. All Rights Reserved. 腾讯云 版权所有
深圳市腾讯计算机系统有限公司 ICP备案/许可证号:粤B2-20090059 ![]() 粤公网安备44030502008569号
粤公网安备44030502008569号
腾讯云计算(北京)有限责任公司 京ICP证150476号 | 京ICP备11018762号