
按年划分的滤波点
按年划分的滤波点
提问于 2021-12-16 17:28:20
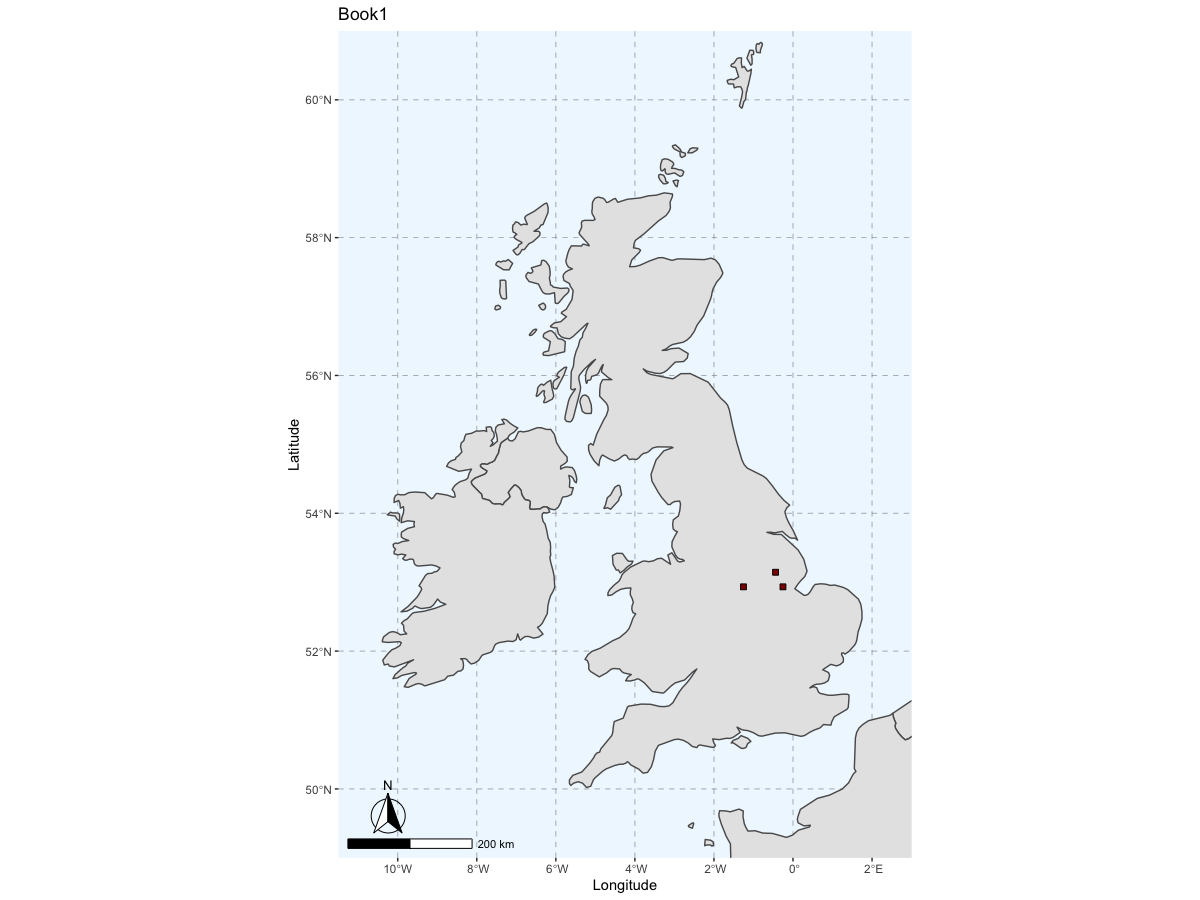
我在英国地图上用ggplot2绘制了物种发生记录。在我的csv中,有一个记录年份的列--如何添加一个过滤器,以便只绘制来自特定年份/年份的记录,而不是所有的记录?代码在下面,高兴的用地图设计,只想画一些记录!
library(ggplot2)
library("sf")
library(rnaturalearth)
library(rnaturalearthdata)
library(ggspatial)
book1points <- read.csv("removeddirectoryforprivacy.csv")
theme_set(theme_bw())
world <- ne_countries(scale = "medium", returnclass = "sf")
class(world)
ggplot(data = world) +
  geom_sf() +
  geom_point(data = book1points, aes(x = lon, y = lat), size = 0.4, shape = 22, fill = "darkred") +
  xlab("Longitude") + ylab("Latitude") +
  ggtitle("Book1") +
  annotation_scale(location = "bl", width_hint = 0.3) +
  annotation_north_arrow(location = "bl", which_north = "true",
                         pad_x = unit(0.22, "in"), pad_y = unit(0.2, "in"),
                         style = north_arrow_fancy_orienteering) +
  coord_sf(xlim=c(-11.5,3), ylim=c(49,61), expand = FALSE) +
theme(panel.grid.major = element_line(color = gray(0.5), linetype = "dashed", size = 0.2), panel.background = element_rect(fill = "aliceblue"))回答 1
Stack Overflow用户
回答已采纳
发布于 2021-12-16 18:43:13
正如@GregorThomas所提到的,您希望给ggplot一个子集。您可以对filter中的数据使用geom_point。
library(tidyverse)
library(sf)
library(rnaturalearth)
library(rnaturalearthdata)
library(ggspatial)

ggplot(data = world) +
  geom_sf() +
  geom_point(
    data = book1points %>% dplyr::filter(year == 2021),
    aes(x = lon, y = lat),
    size = 0.4,
    shape = 22,
    fill = "darkred"
  ) +
  xlab("Longitude") + ylab("Latitude") +
  ggtitle("Book1") +
  annotation_scale(location = "bl", width_hint = 0.3) +
  annotation_north_arrow(
    location = "bl",
    which_north = "true",
    pad_x = unit(0.22, "in"),
    pad_y = unit(0.2, "in"),
    style = north_arrow_fancy_orienteering
  ) +
  coord_sf(xlim = c(-11.5, 3),
           ylim = c(49, 61),
           expand = FALSE) +
  theme(
    panel.grid.major = element_line(
      color = gray(0.5),
      linetype = "dashed",
      size = 0.2
    ),
    panel.background = element_rect(fill = "aliceblue")
  )
输出
或者,如果你有几年的时间,那么你可以使用:
data = book1points %>% dplyr::filter(year %in% 2020:2021)或者,正如@GregorThomas所提供的,您也可以在该行中使用基R代替dplyr。
data = subset(book1points, year == 2020)
data = subset(book1points, year %in% 2020:2021)
数据
book1points <- structure(list(
  lon = c(-2.1767,-0.44086,-2.791934,-1.253848,-0.253848),
  lat = c(54.236969, 53.144121, 52.386316, 52.932735,
        52.932735),
  year = c(2020, 2021, 2020, 2021, 2021)
),
class = "data.frame",
row.names = c(NA,-5L))页面原文内容由Stack Overflow提供。腾讯云小微IT领域专用引擎提供翻译支持
原文链接:
https://stackoverflow.com/questions/70383220
复制相关文章
相似问题
腾讯云开发者

Copyright © 2013 - 2026 Tencent Cloud. All Rights Reserved. 腾讯云 版权所有
深圳市腾讯计算机系统有限公司 ICP备案/许可证号:粤B2-20090059 ![]() 粤公网安备44030502008569号
粤公网安备44030502008569号
腾讯云计算(北京)有限责任公司 京ICP证150476号 | 京ICP备11018762号