
在所选维度的值之间切片/选择netCDF - Python
我对python和netCDF文件操作都很陌生。
我试图使用来自两个.nc文件的深度数据对数组的深度进行切片。
我想要切片的文件是temp,而另外两个文件分别指冬季mld_winter和夏季mld_summer中的混合层深度(结构相似,只是深度值不同)。
>>> temp
<xarray.Dataset>
Dimensions:    (XC: 2160, YC: 588, Z: 52, time: 84)
Coordinates: (12/15)
    iter       (time) int64 ...
  * time       (time) datetime64[ns] 2013-01-30T20:40:00 ... 2019-12-31T14:20:00
  * XC         (XC) float32 0.08333 0.25 0.4167 0.5833 ... 359.6 359.8 359.9
  * YC         (YC) float32 -77.98 -77.95 -77.91 -77.88 ... -30.02 -29.87 -29.72
  * Z          (Z) float32 -2.1 -6.7 -12.15 -18.55 ... -5e+03 -5.4e+03 -5.8e+03
    rA         (YC, XC) float32 ...
    ...         ...
    maskC      (Z, YC, XC) bool ...
    maskCtrlC  (Z, YC, XC) bool ...
    rhoRef     (Z) float32 ...
    rLowC      (YC, XC) float32 ...
    maskInC    (YC, XC) bool ...
    rSurfC     (YC, XC) float32 ...
Data variables:
    TEMPERATURE     (time, Z, YC, XC) float32 ...


>>> ```mld_winter```
<xarray.DataArray 'Depth' (time: 1, YC: 588, XC: 2160)>
array([[[ -0.      ,  -0.      ,  -0.      , ...,  -0.      ,
          -0.      ,  -0.      ],
        [ -0.      ,  -0.      ,  -0.      , ...,  -0.      ,
          -0.      ,  -0.      ],
        [ -0.      ,  -0.      ,  -0.      , ...,  -0.      ,
          -0.      ,  -0.      ],
        ...,
        [-92.74558 , -91.05976 , -89.990906, ..., -91.42767 ,
         -92.38585 , -92.182274],
        [-90.842384, -90.53973 , -89.26402 , ..., -90.02215 ,
         -89.696655, -88.83551 ],
        [-89.26157 , -89.02418 , -86.94184 , ..., -87.80376 ,
         -87.4023  , -86.835205]]], dtype=float32)
Coordinates:
  * time     (time) datetime64[ns] 2021-07-31T22:40:00
  * XC       (XC) float32 0.08333 0.25 0.4167 0.5833 ... 359.4 359.6 359.8 359.9
  * YC       (YC) float32 -77.98 -77.95 -77.91 -77.88 ... -30.02 -29.87 -29.72
我正在寻找夏季(顶部)和冬季(底部)层的温度数据,其中:
mld_winter
我尝试使用temp对numpy进行切片,如下所示:
temp_mld = np.squeeze(temp.TEMPERATURE.sel(Z > mld_winter & Z < mld_summer))
NameError: name 'Z' is not defined如果我只使用一个操作符对temp进行切片,我将获得:
temp_mld = np.squeeze(temp.TEMPERATURE.sel(Z > mld_winter))
NameError: name 'Z' is not defined
或
temp_mld = np.squeeze(temp.TEMPERATURE.sel(Z = mld_winter))
KeyError: "not all values found in index 'Z'"
或
temp_mld = np.squeeze(temp.TEMPERATURE.sel(Z > -60)) #-60 is an example
NameError: name 'Z' is not defined编辑:然而,,切片,例如,由Z = slice(-6, -40),它的工作。因此,我试图通过使用mld数据创建一个片段来生成一系列的值,但仍然返回一个错误:
winter_mld_bound = slice(mld_summer, mld_winter)
temp_mld = np.squeeze(temp.TEMPERATURE.sel(Z = mld_winter_bound))

ValueError: cannot use non-scalar arrays in a slice for xarray indexing: [[[  1.         1.         1.       ...   1.         1.         1.      ]
      [  1.         1.         1.       ...   1.         1.         1.      ]
      [  1.         1.         1.       ...   1.         1.         1.      ]
      ...
      [-91.74558  -90.05976  -88.990906 ... -90.42767  -91.38585  -91.182274]
      [-89.842384 -89.53973  -88.26402  ... -89.02215  -88.696655 -87.83551 ]
[-88.26157 -88.02418 -85.94184 ... -86.80376 -86.4023 -85.835205]]]回答 1
Stack Overflow用户
发布于 2021-12-15 10:42:00
我已经找到了您正在使用的netCDF文件(B),所以我编写的代码应该可以工作。
这些是我使用的代码工作包。
from dask.diagnostics import ProgressBar
import xarray as xr
import pooch我使用一个名为pooch的包来下载数据。看看它,对于较小的文件来说,它是相当整洁的。我所做工作的一个关键部分是使用xarray的xarray部分。它允许对netCDF文件使用延迟加载,这意味着数据必须加载才能加载。这意味着您可以处理实际上比内存大得多的文件(这并不总是起作用)。
def download(url):
    """pooch is a package to download data - returns the local file path"""
    fname = pooch.retrieve(
        url, None,
        fname=url.split('/')[-1],
        path='some_data_repository/bsose/iter133/',
        downloader=pooch.HTTPDownloader(progressbar=True))

    return fname

# download the data and return the local fname
mld_fname = download('http://sose.ucsd.edu/SO6/ITER133/bsose_i133_2013to2018_30day_MLD.nc')
# I use xr.open_mfdataset since it automatically uses dask and does lazy computing
# this means that it doesnt load the data until the last possible moment
mld = xr.open_mfdataset(mld_fname).BLGMLD

tmp_fname = download("http://sose.ucsd.edu/SO6/ITER133/bsose_i133_2013to2018_monthly_Theta.nc")
temp = xr.open_mfdataset(tmp_fname, chunks=dict(time=12, Z=5)).THETA

# I make depth positive since MLD is positive and we want to compare these
depth = -temp.Z
下一步是找到夹带层(至少我是这么理解的)。我是根据气候学做这件事的,因为这比较容易。当然,对于年际数据,您可以这样做,但这需要一些诡计的日期。
# groupby is amazing, I use it a lot - read the documentation
mld_season_clim = mld.groupby('time.season').mean('time')
mld_smr_clim = mld_season_clim.sel(season='DJF')
mld_wnt_clim = mld_season_clim.sel(season='JJA')

# The entrainment layer is the water mass between the winter and summer climatology
# this has to be compared against depth - note that we changed the sign of
# depth to be compatible with MLD earlier on. The output is a boolean mask (True|False)
entrainment_layer = (depth > mld_smr_clim) & (depth < mld_wnt_clim)最后,我们可以使用bool掩码来选择夹带层的数据。如果没有数据(为了节省内存),函数调用的drop=True部分只是移除一行/col。这意味着你会在温度下失去非常深的深度。这里的输出仍然是“懒惰”的,因此要实际加载这些数据,需要使用.load() / .compute()。
entrainment_temp = temp.where(entrainment_layer, drop=True)

with ProgressBar():
    entrainment_temp = entrainment_temp.compute()
这应该就行了!
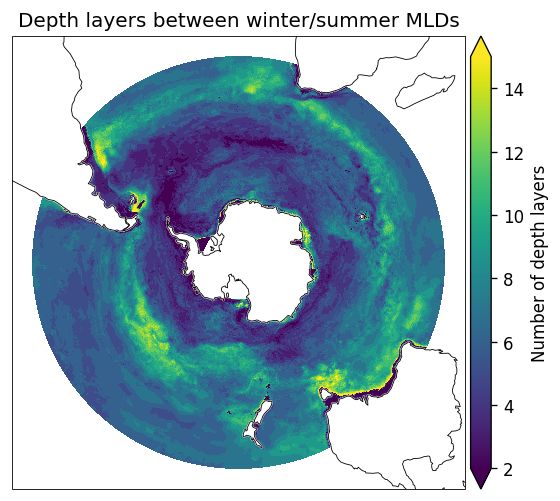
最后,我编写了一个用cartopy绘制数据的快速函数。根据这里的输出,我认为我做了正确的事情。
from matplotlib import pyplot as plt
from cartopy import crs, feature


def plot_bsose(da, **kwargs):
    """for quick plotting SPstereo maps"""

    fig, ax = plt.subplots(
        figsize=[6, 5], dpi=120,
        subplot_kw=dict(projection=crs.SouthPolarStereo(true_scale_latitude=55)))

    props = dict(robust=True, cbar_kwargs=dict(pad=0.01), transform=crs.PlateCarree())
    props.update(kwargs)

    img = da.plot(ax=ax, **props)

    ax.coastlines(lw=0.5, zorder=11)
    ax.add_feature(feature.LAND, fc='w', zorder=10)
    ax.spines['geo'].set_zorder(12)
    ax.spines['geo'].set_lw(0.5)

    return img


img = plot_bsose(entrainment_layer.sum('Z'), vmax=15, vmin=2)
img.axes.set_title('Depth layers between winter/summer MLDs')
img.colorbar.set_label('Number of depth layers')
https://stackoverflow.com/questions/70337856
复制相似问题
腾讯云开发者

Copyright © 2013 - 2026 Tencent Cloud. All Rights Reserved. 腾讯云 版权所有
深圳市腾讯计算机系统有限公司 ICP备案/许可证号:粤B2-20090059 ![]() 粤公网安备44030502008569号
粤公网安备44030502008569号
腾讯云计算(北京)有限责任公司 京ICP证150476号 | 京ICP备11018762号