
光谱材料中的发现峰b
光谱材料中的发现峰b
提问于 2021-12-12 15:00:01
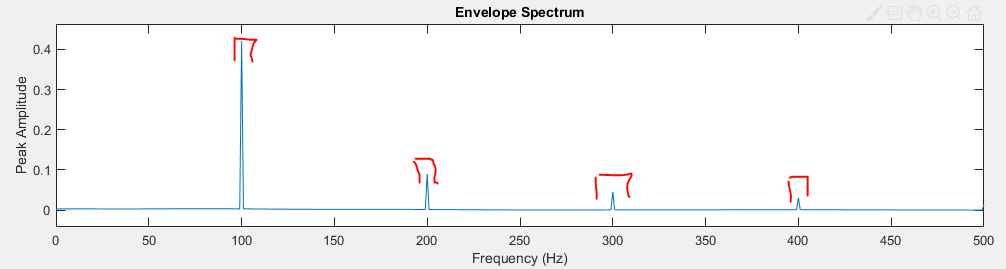
我试图在光谱中找到峰值,但我只需要提取基频及其谐波的峰值,即红色矩形。如何排除基频之前的任何内容,而只包括基频及其3次谐波。我使用这段代码,但没有帮助。有什么想法吗?
pks = findpeaks(q);
findpeaks(q,'MinPeakDistance',99)
%findpeaks(q,'MinPeakHeight',0.0004)
xlim([0.1 500])
使用时:
    Fs = 1000;
t = 0:0.001:1-0.001;    % 250-Hz sine wave modulated at 100 Hz
x = [1+cos(2*pi*100*t)].*cos(2*pi*250*t);
%envspectrum(x,Fs)
[ES,F]=envspectrum(x,Fs);

%%
findpeaks(ES,F)
% Now for only > 99 Hz (choose the freq you fancy)
idx = F >= 99; % greater than 99 Hz
findpeaks(ES(idx),F(idx)) % idx only select those F > 99
% Good? Keep the values of  amplitud and location (in frequencies) of the ES
[pks,loc] = findpeaks(ES(idx),F(idx));
% If you just want to have the first 5 peaks (or the n? you choose):
% Select only 3 first.
if length(pks) > 3  % Check you didnt get less peaks
    pks = pks(1:3);
    loc = loc(1:3);
end
% To plot the peaks in the envelope
plot(F(idx),ES(idx),loc,pks,'r*')
我明白了:
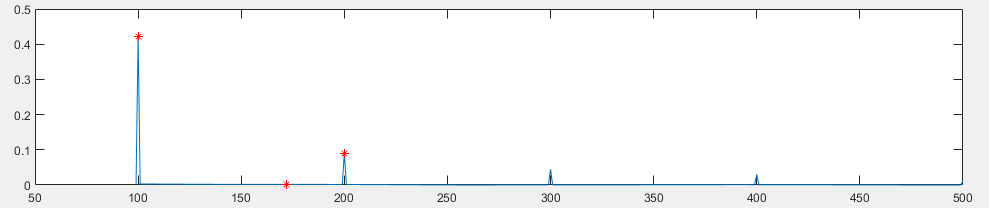
其结果是:

回答 1
Stack Overflow用户
回答已采纳
发布于 2021-12-12 16:58:16
编辑以适应新代码的示例。我们应用于信号的包络谱- [ES,F] = envspectrum(sig,Fs);-,因此我们知道信号及其频率采样(fs)。
仍然是相同的过程。您只需计算findpeaks()中那些高于250 Hz的信号样本的值即可。为此,为要为下列频率值定义一个逻辑数组:
idx = F >= 250; % 250 Hz并将此逻辑索引应用于要应用函数findpeaks()的信号和频率的包络谱。
[pks,loc] = findpeaks(ES(idx),F(idx));示例:
% Let's create a signal with fs = 2500 Hz
% This is just to create an example, don't worry about these lines
fs = 2500;
f0 = 25;
n = 8;
d = 0.02;
p = 0.12;
t = 0:1/fs:1-1/fs;
z = [1 0.5 0.2 0.1 0.05]*sin(2*pi*f0*[1 2 3 4 5]'.*t)/5;
% z: our signal
% t: time array of the signal (to plot)

% How does the signal look?
plot(t,z)

% Calculating the envelope signal and its spectrum
[ES,F]=envspectrum(z,fs);
% Plot the envelop if you want:
envspectrum(z,fs)

% ES: Envelope spectrum of the signal
% F: array of frequencies used for the spectrum (half our fs for Nyquist Theorem)

% Find the peaks of the envelope spectrum
   % Let's see how it is for all the envelope
findpeaks(ES,F)
   % Now for only > 250 Hz (choose the freq you fancy)
idx = F >= 250; % greater than 250 Hz
findpeaks(ES(idx),F(idx)) % idx only select those F > 250
   % Good? Keep the values of  amplitud and location (in frequencies) of the ES
      % Use 'NPeaks' input to tell function to select only 5 first peaks it can find.
[pks,loc] = findpeaks(ES(idx),F(idx), 'NPeaks', 5);

% To plot the peaks in the envelope
plot(F(idx),ES(idx),loc,pks,'r*')
% Note in this example the first peak (in 250 Hz) is not selected
% because is not a local maximum when we narrow the envelope.

 % If the function select false peaks somehow, you can use
 %'MinPeakHeight' to specify an absolute amplitude, 'MinPeakProminence '
 %for a relative amplitude or 'Threshold' inputs for a better fit.
https://uk.mathworks.com/matlabcentral/answers/768537-use-findpeaks-on-specific-frequency-range
页面原文内容由Stack Overflow提供。腾讯云小微IT领域专用引擎提供翻译支持
原文链接:
https://stackoverflow.com/questions/70324725
复制相关文章
相似问题
腾讯云开发者

Copyright © 2013 - 2026 Tencent Cloud. All Rights Reserved. 腾讯云 版权所有
深圳市腾讯计算机系统有限公司 ICP备案/许可证号:粤B2-20090059 ![]() 粤公网安备44030502008569号
粤公网安备44030502008569号
腾讯云计算(北京)有限责任公司 京ICP证150476号 | 京ICP备11018762号