
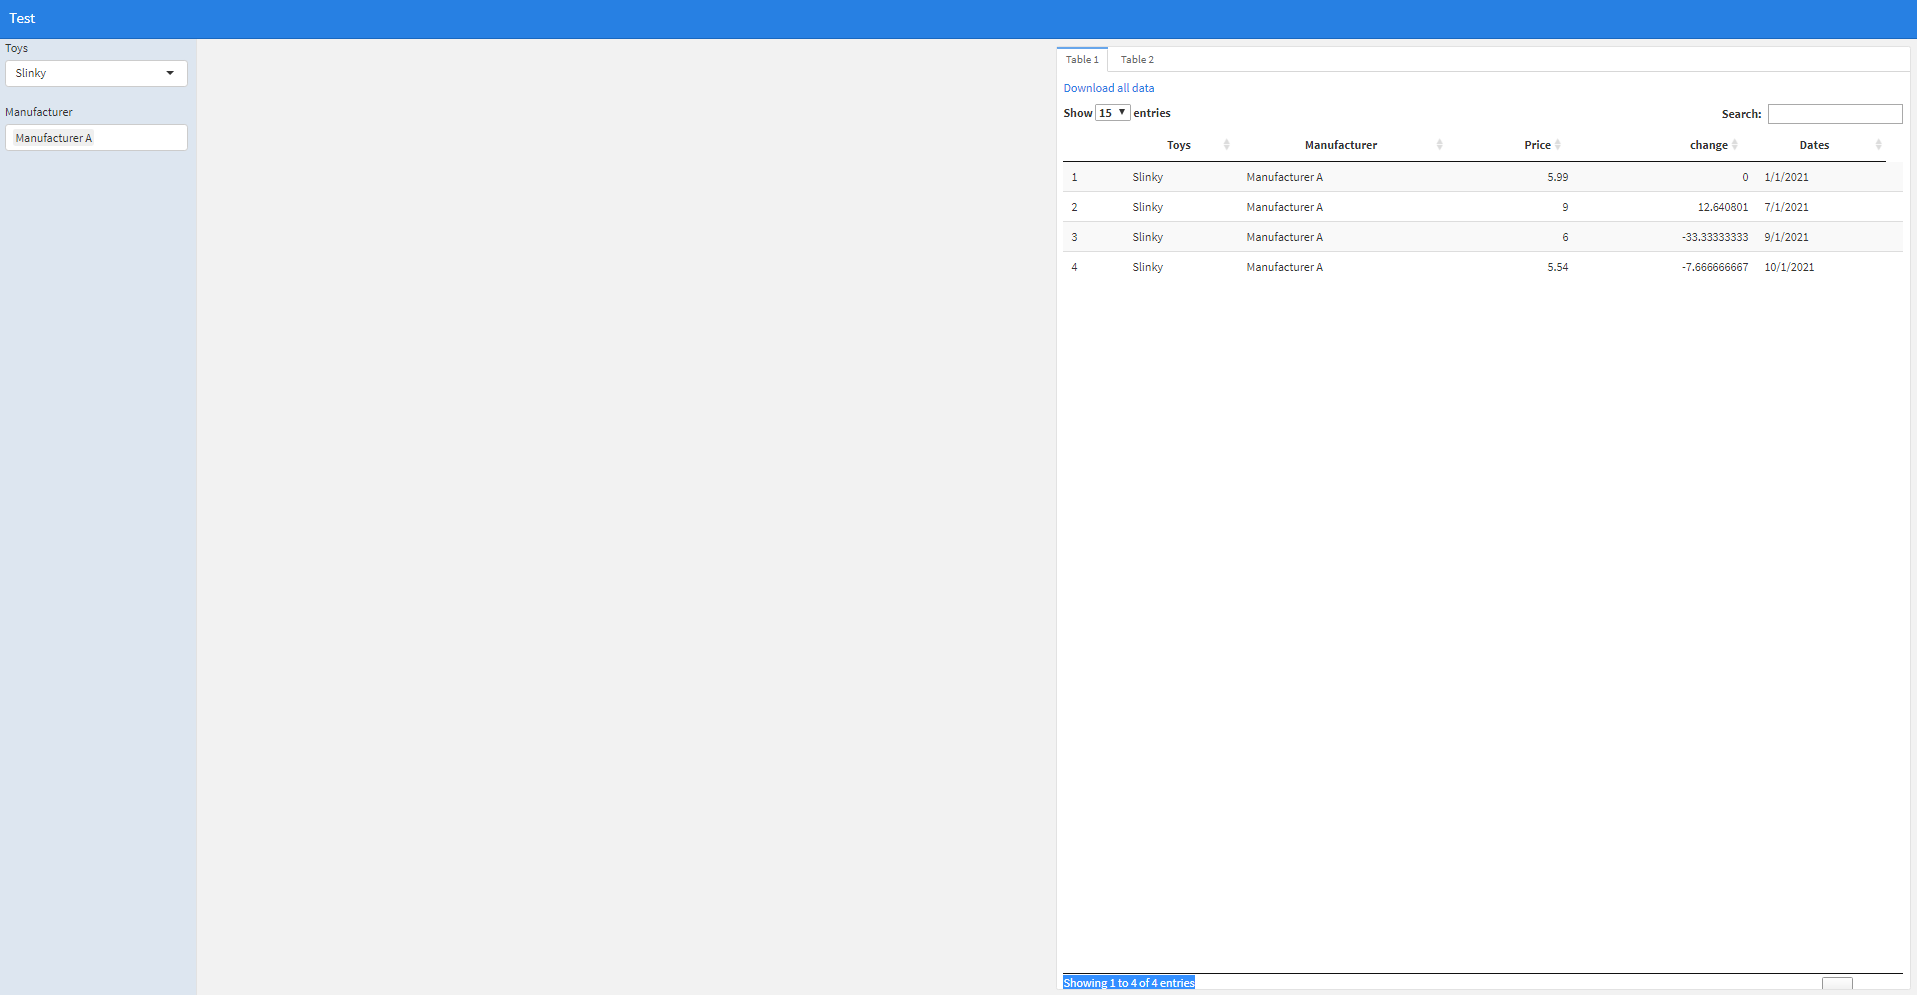
在柔性仪表板中添加下载处理程序时,分页被切断。
我有一个问题,下载处理程序从闪亮(downloadHandler)和呈现一个表使用DT (使用renderDataTable)。当我使用下载处理程序并在我的柔性仪表板应用程序中呈现表时,分页将被切断。因此,用户无法切换到表的不同页面,因为分页不适合呈现表的容器或“框”。只有当我包含downloadHandler时才会发生这种情况。如果我包括使用从DT扩展按钮,分页不会被切断。问题是我需要使用downloadHandler,因为我的应用程序中的数据量相当大。请注意,示例数据并不代表数据的大小。有人知道如何解决这个问题吗?
下面是我使用的代码:
---
title: "Test"
output:
  flexdashboard::flex_dashboard:
  orientation: rows
  vertical_layout: fill

runtime: shiny
---

```{r global, include=FALSE}
图书馆(Dplyr)
图书馆(Tidyquant)
图书馆(Ggplot2)
库(弦R)
图书馆(Tidyr)
图书馆(引脚)
图书馆(闪亮)
图书馆(Httr)
库(XML)
图书馆(DT)
图书馆(巧妙地)
图书馆(Purrr)
test_data <-结构(列表(Toys= c("Slinky",“Slinky”),
"Slinky","Slinky","Tin Solider","Tin Solider",
“锡石”,“饥饿的河马”,
“饥饿的河马”,“饥饿的河马”,“饥饿的河马”,
“饥饿的河马”,“饥饿的河马”,制造商=c(“制造商A",
“制造商B”、“制造商C”、“制造商A”、“制造商A”、
“制造商A”、“制造商B”、“制造商B”、“制造商B",
“制造商B",”制造商C",
“制造商C",”制造商C",
),价格= c(5.99,6.99,7.99,9,6,5.54,7,
9.99、6.99、6.75、8、7.99、9.99、7.99、5.99、8.99、10.99、9.75
),更改= c(0,16.69449082,14.30615165,12.640801,-33.33333333,
-7.666666667,0,42.71428571,-30.03003003,-3.433476395,18.5185185
-0.125,0,-20.02002002,-25.03128911,50.08347245,22.24694105,
-11.28298453),日期= c("1/1/2021","3/1/2021","5/1/2021",
"7/1/2021“、"9/1/2021”、"10/1/2021“、"1/1/2021”、"3/1/2021",
"5/1/2021“、"7/1/2021”、"9/1/2021“、"10/1/2021”、"1/1/2021",
"3/1/2021","5/1/2021","7/1/2021","9/1/2021",“10/1/2021”),class = "data.frame",row.names = c(NA,
-18L)
名称(Test_data) <- c(“玩具”、“制造商”、“价格”、“更改”、“日期”)
Sidebar {.sidebar}
-----------------------------------------------------------------------

```{r}
selectInput(“玩具”)
label = "Toys", choices = unique(sort(test_data$Toys)), selected = "Slinky")selectizeInput(“制造商”)
label = "Manufacturer", choices = c("Select All",as.character(unlist(test_data %>% dplyr::select(Manufacturer) %>% dplyr::arrange(Manufacturer) %>% distinct()))), multiple = TRUE, options = list(placeholder = 'Make a selection below')) Column
-------------------------------------
```{r}#Hides初始错误消息
标签$style(type=“text/css”)
“.闪亮-输出-错误{可见性:隐藏;}",
“.闪亮-输出-错误:在{可见性:隐藏之前;}”
)
观察({
if (!is.null(输入$Toys)){
updateSelectInput(
inputId = "Manufacturer",choices =c("Select All", test_data %>% dplyr::filter(Toys == input$Toys) %>% dplyr::select(Manufacturer) %>% dplyr::distinct() %>% dplyr::pull(Manufacturer) %>% str_sort),selected = test_data %>% dplyr::filter(Toys == input$Toys) %>% dplyr::select(Manufacturer) %>% dplyr::distinct() %>% slice_head())}
})
观察({
如果(在%输入$制造商中“选择所有”%){
updateSelectInput( inputId = "Manufacturer", selected = test_data %>% dplyr::filter(Toys == input$Toys) %>% dplyr::select(Manufacturer) %>% dplyr::distinct() %>% dplyr::pull(Manufacturer) %>% str_sort )}
})
Toys_reactive <-反应性({
如果(长度(唯一(test_data$Manufacturer)) >= 1){
Toys_reactive = NULLfor(i in input$Manufacturer){ subset_toys <- test_data %>% dplyr::filter(Manufacturer == i & Toys == input$Toys) Toys_reactive <- rbind(Toys_reactive, subset_toys)}}
Toys_reactive
})
{.tabset .tabset-fade}
-------------------------------------

### Table 1
```{r}
downloadLink(‘downBtn1 1’,‘下载所有数据’)
输出$downloadUI <- renderUI( {
downloadButton("downBtn1","Example.csv")
})
输出$Down1 <- downloadHandler(
filename = function() {
"Example.csv"},
内容=函数(文件){
write.csv(Toys_reactive(), file, row.names = FALSE)}
)
DT::renderDataTable({
数据表(Toys_reactive(),
fillContainer = TRUE, options = list(dom = 'lfrtip', lengthMenu = list(c(15,30,45,-1), c(15,30,45,"All"))))})
回答 1
Stack Overflow用户
发布于 2021-12-09 16:43:12
经过多次试验和错误之后,我找到了一个可行的解决方案。我已经使用css块将重载从隐藏更改为自动。当表溢出容器时,这个块会显示分页。`{css我的样式,echo = FALSE}
.chart-wrapper .chart-stage {
    overflow: auto;
}Entire test code with addition chunk:
----
```javascript标题:“测试”
产出:
flexdashboard::flex_dashboard:
运行时:闪亮
library(dplyr)
library(tidyquant)
library(ggplot2)
library(stringr)
library(tidyr)
library(pins)
library(shiny)
library(httr)
library(XML)
library(DT)
library(plotly)
library(purrr)


test_data  <- structure(list(Toys = c("Slinky", "Slinky", "Slinky", "Slinky",
"Slinky", "Slinky", "Tin Solider", "Tin Solider", "Tin Solider",
"Tin Solider", "Tin Solider", "Tin Solider", "Hungry Hungry Hippo",
"Hungry Hungry Hippo", "Hungry Hungry Hippo", "Hungry Hungry Hippo",
"Hungry Hungry Hippo", "Hungry Hungry Hippo"), Manufacturer = c("Manufacturer A",
"Manufacturer B", "Manufacturer C", "Manufacturer A", "Manufacturer A",
"Manufacturer A", "Manufacturer B", "Manufacturer B", "Manufacturer B",
"Manufacturer B", "Manufacturer B", "Manufacturer B", "Manufacturer C",
"Manufacturer C", "Manufacturer C", "Manufacturer C", "Manufacturer C",
"Manufacturer C"), Price = c(5.99, 6.99, 7.99, 9, 6, 5.54, 7,
9.99, 6.99, 6.75, 8, 7.99, 9.99, 7.99, 5.99, 8.99, 10.99, 9.75
), change = c(0, 16.69449082, 14.30615165, 12.640801, -33.33333333,
-7.666666667, 0, 42.71428571, -30.03003003, -3.433476395, 18.51851852,
-0.125, 0, -20.02002002, -25.03128911, 50.08347245, 22.24694105,
-11.28298453), Dates = c("1/1/2021", "3/1/2021", "5/1/2021",
"7/1/2021", "9/1/2021", "10/1/2021", "1/1/2021", "3/1/2021",
"5/1/2021", "7/1/2021", "9/1/2021", "10/1/2021", "1/1/2021",
"3/1/2021", "5/1/2021", "7/1/2021", "9/1/2021", "10/1/2021")), class = "data.frame", row.names = c(NA,
-18L))
names(test_data) <- c("Toys", "Manufacturer", "Price", "change", "Dates")
侧栏{.sidebar}
selectInput("Toys",
            label = "Toys",
            choices = unique(sort(test_data$Toys)),
            selected = "Slinky")


selectizeInput("Manufacturer",
            label = "Manufacturer",
            choices = c("Select All",as.character(unlist(test_data %>%
                        dplyr::select(Manufacturer) %>%
                        dplyr::arrange(Manufacturer) %>%
                        distinct()))),
            multiple = TRUE,
            options = list(placeholder = 'Make a selection below'))
列
#Hides initial error messages
tags$style(type="text/css",
  ".shiny-output-error { visibility: hidden; }",
  ".shiny-output-error:before { visibility: hidden; }"
)


observe({
if (!is.null(input$Toys)){
  updateSelectInput(
    inputId = "Manufacturer",
    choices =c("Select All", test_data %>%
      dplyr::filter(Toys == input$Toys) %>%
      dplyr::select(Manufacturer) %>%
      dplyr::distinct() %>%
      dplyr::pull(Manufacturer) %>%
      str_sort),
    selected = test_data %>%
      dplyr::filter(Toys == input$Toys) %>%
      dplyr::select(Manufacturer) %>%
      dplyr::distinct() %>% slice_head()
    )
  }
})

observe ({
  if("Select All" %in% input$Manufacturer){
    updateSelectInput(
      inputId = "Manufacturer",
    selected = test_data %>%
      dplyr::filter(Toys == input$Toys) %>%
      dplyr::select(Manufacturer) %>%
      dplyr::distinct() %>%
      dplyr::pull(Manufacturer) %>%
      str_sort
    )
  }
})

Toys_reactive <- reactive({
  if(length(unique(test_data$Manufacturer)) >= 1){
    Toys_reactive = NULL
    for(i in input$Manufacturer){
      subset_toys <- test_data %>%
        dplyr::filter(Manufacturer == i & Toys == input$Toys)
      Toys_reactive <- rbind(Toys_reactive, subset_toys)
    }
  }
  Toys_reactive
})
{.tabset .制表-淡入}
表1
output$table1 <- DT::renderDataTable({
datatable(Toys_reactive(),
          fillContainer = TRUE,
          options = list(dom = 'lfrtip',
                           lengthMenu = list(c(15,30,45,-1),
                                             c(15,30,45,"All"))))

})

downloadLink('downBtn1', 'Download all data')
output$downloadUI <- renderUI( {
  downloadButton("downBtn1", "Example.csv")
})

output$downBtn1 <- downloadHandler(
  filename = function() {
    "Example.csv"
  },
  content = function(file) {
    write.csv(Toys_reactive()[input[["table1_rows_all"]],], file, row.names = FALSE)
  }
)

tabsetPanel(tabPanel("Table1", dataTableOutput("table1")))
表2
downloadLink('downBtn', 'Download all data')
output$downloadUI <- renderUI( {
  downloadButton("downBtn", "Example.csvv")
})

output$downBtn <- downloadHandler(
  filename = function() {
    "Example.csv"
  },
  content = function(file) {
    write.csv(Toys_reactive(), file, row.names = FALSE)
  }
)


DT::renderDataTable({
datatable(Toys_reactive(),
          fillContainer = TRUE,
          options = list(dom = 'lfrtip',
                           lengthMenu = list(c(15,30,45,-1),
                                             c(15,30,45,"All"))))

}).chart-wrapper .chart-stage {
overflow: auto;
}如果有人有一个更好的解决方案,请包括它,但我会接受这个答案在一天之内。
https://stackoverflow.com/questions/70278646
复制相似问题
腾讯云开发者

Copyright © 2013 - 2026 Tencent Cloud. All Rights Reserved. 腾讯云 版权所有
深圳市腾讯计算机系统有限公司 ICP备案/许可证号:粤B2-20090059 ![]() 粤公网安备44030502008569号
粤公网安备44030502008569号
腾讯云计算(北京)有限责任公司 京ICP证150476号 | 京ICP备11018762号