
用一个dataframe的其他列上的多个日期列和条件注释热图
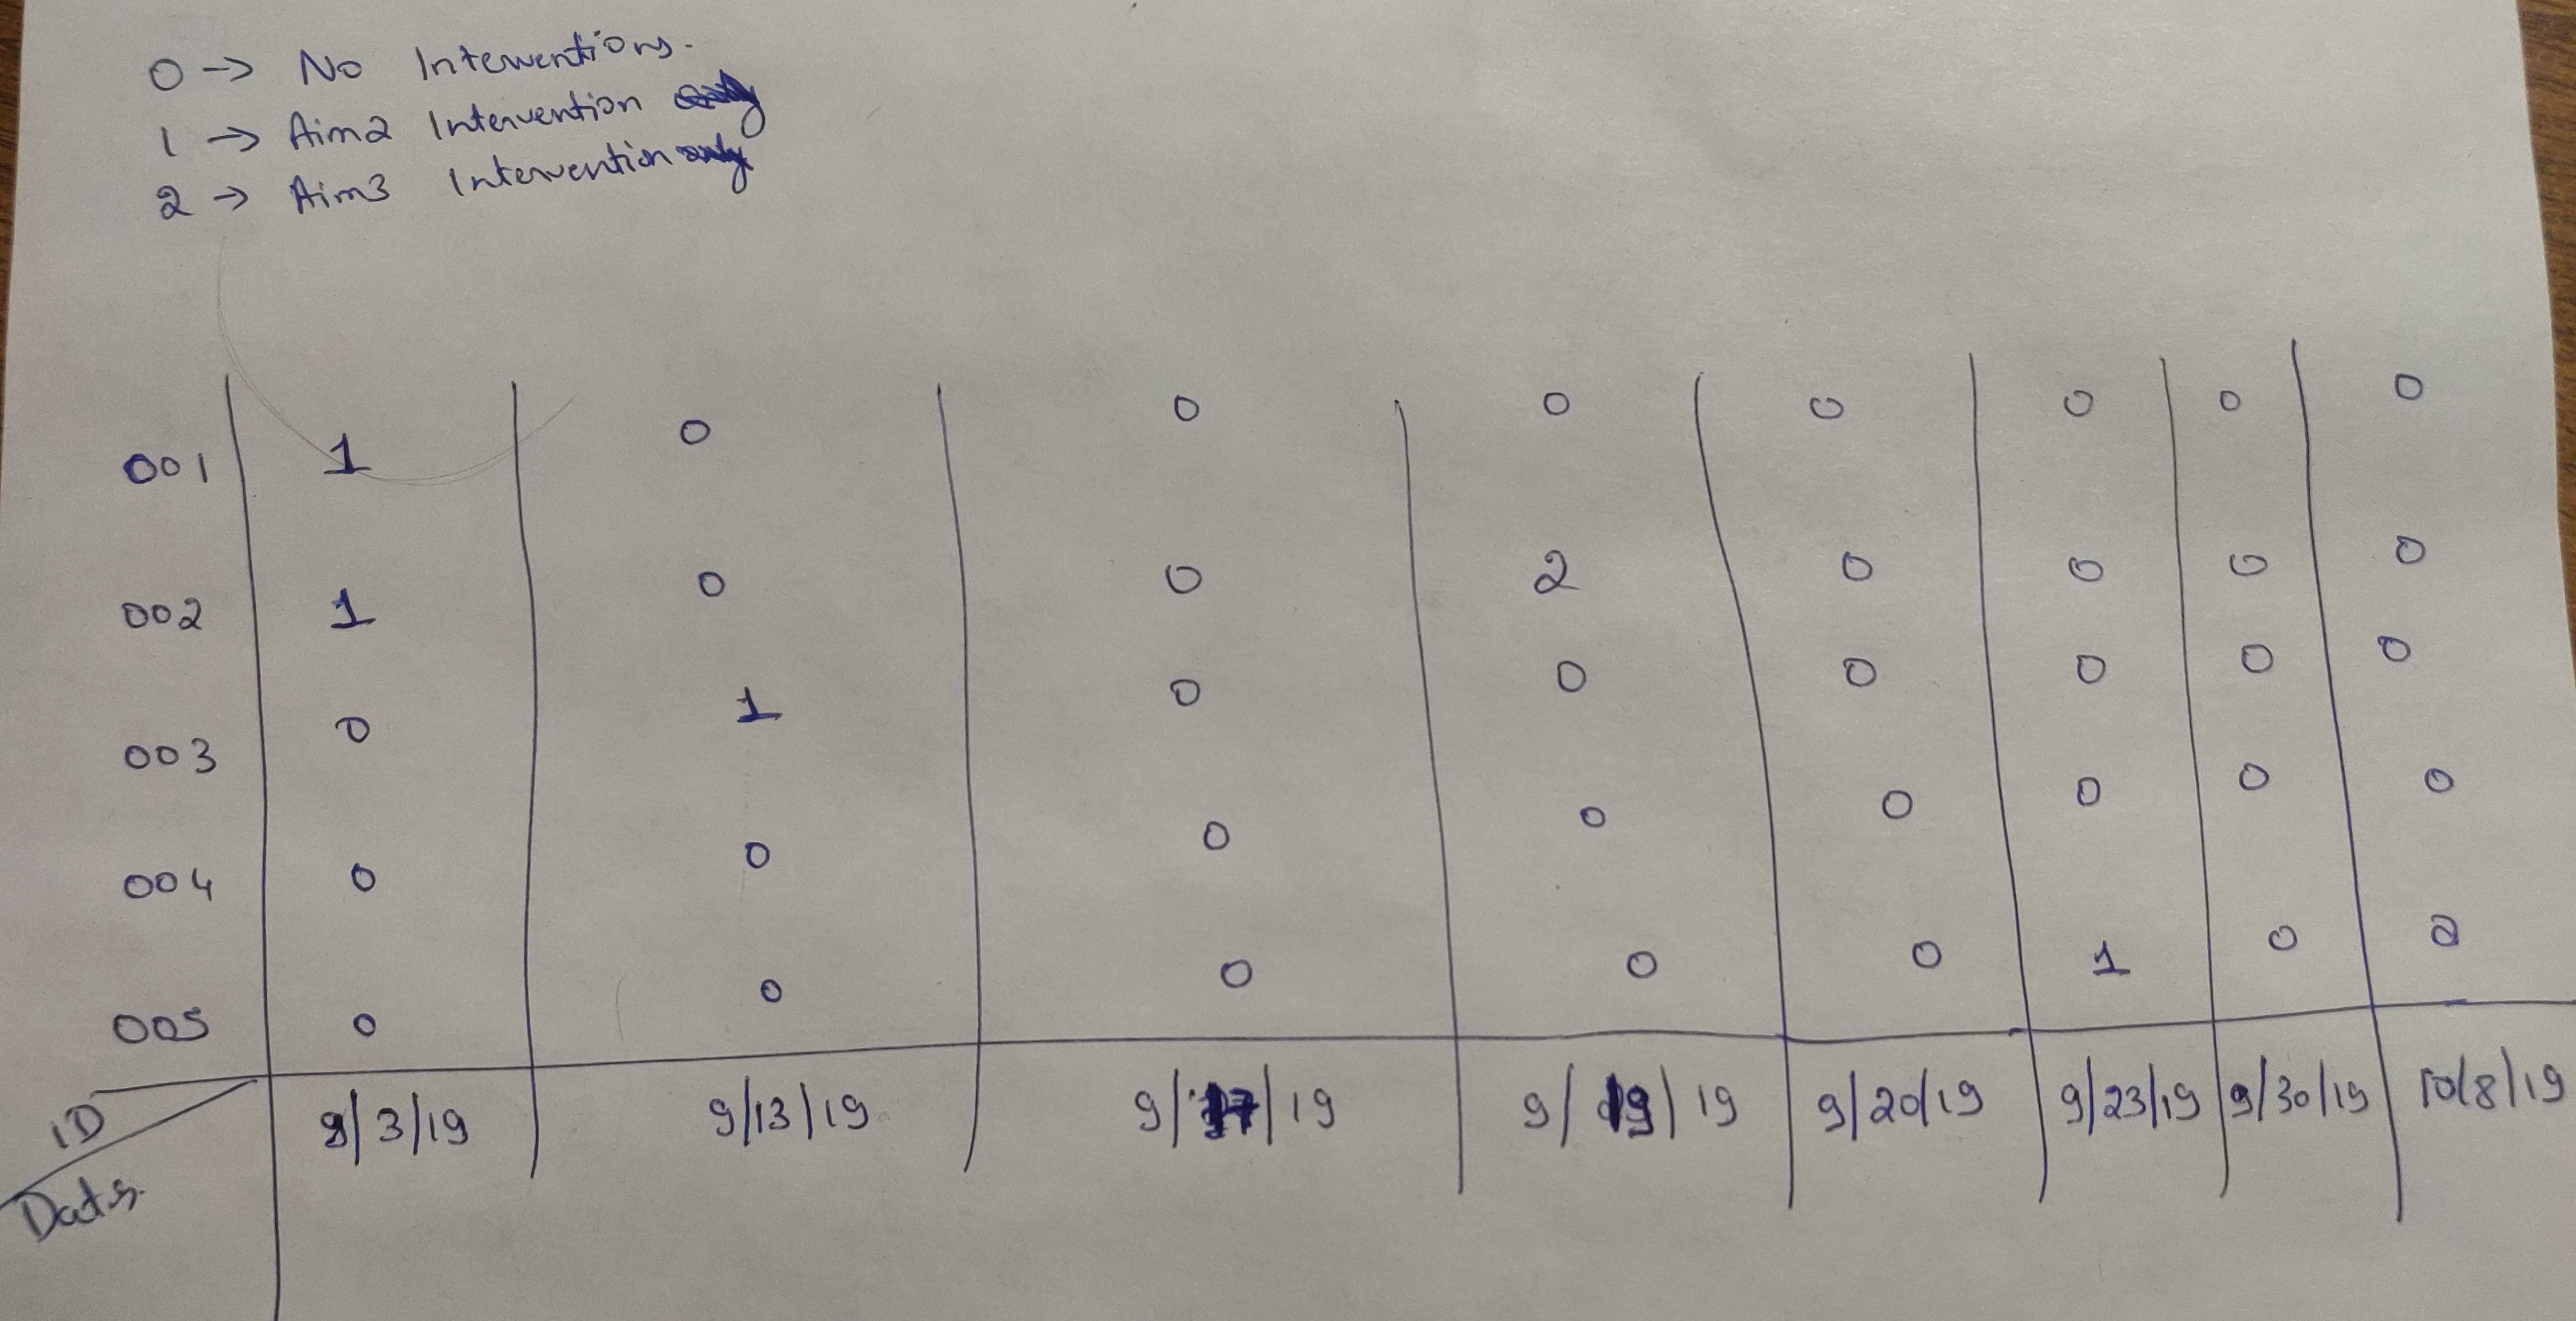
我有一个样本数据如下所示。
import pandas as pd

data = {'ID':['001', '002', '003', '004', '005'],
    'Aim2 Date':['9/3/19', '9/3/19', '9/13/19', '9/20/19', '9/23/19'],
    'Aim2 C/I' :['Intervention', 'Intervention', 'Intervention', 'Control', 'Intervention'],
    'Aim3 Date':['9/17/19','9/19/19','9/27/19','9/30/19','10/8/19'],
    'Aim3 C/I' :['Control', 'Intervention', 'Control', 'Withdraw', 'Withdraw']}

df = pd.DataFrame(data)目标是创建一个热图,其中日期的2列被组合成一个单一的x轴的热映射顺序。热图的y轴有ID号.热图应包括以下3类:
- 0 -如果当天C/I列都没有干预,则
- 1-如果当天
Aim2 C/I列中有“干预”,则为 - 2-如果当天
Aim3 C/I列中存在“干预”。
F 211
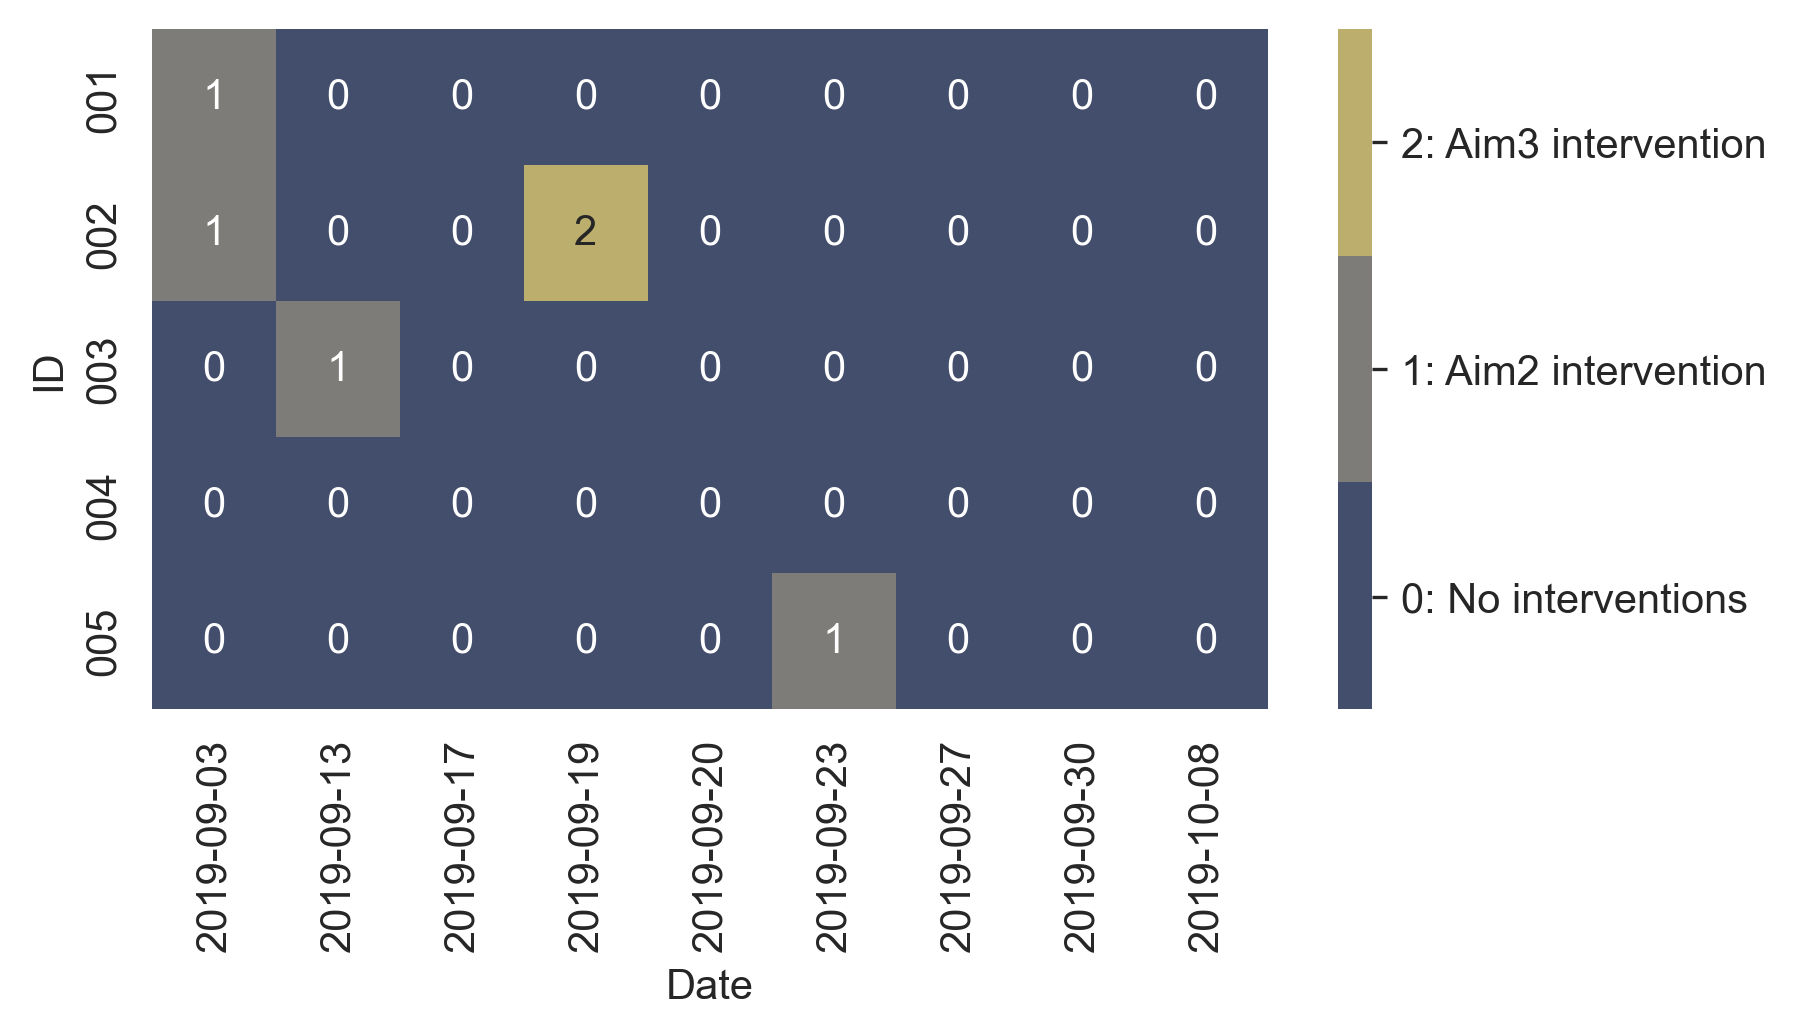
输出的图像如下所示。
我真的很难检查条件,创建类别并在热图中注释它们。
回答 1
Stack Overflow用户
发布于 2021-12-06 02:37:41
首先对数据进行整形;然后热映射本身将是简单明了的:
# map the intervention codes
df['Aim2 C/I'] = np.where(df['Aim2 C/I'] == 'Intervention', 1, 0)
df['Aim3 C/I'] = np.where(df['Aim3 C/I'] == 'Intervention', 2, 0)

# concat the date and C/I columns into long form
df = pd.concat([
    df[['ID', 'Aim2 Date', 'Aim2 C/I']].rename(columns={'Aim2 Date': 'Date', 'Aim2 C/I': 'C/I'}),
    df[['ID', 'Aim3 Date', 'Aim3 C/I']].rename(columns={'Aim3 Date': 'Date', 'Aim3 C/I': 'C/I'}),
])

# pivot the dates into columns
df['Date'] = pd.to_datetime(df['Date']).dt.strftime('%Y-%m-%d')
df = df.pivot_table(index='ID', columns='Date', fill_value=0).droplevel(0, axis=1)

# plot the annotated heatmap with discretized colorbar
ax = sns.heatmap(df, annot=True, cmap=sns.color_palette('cividis', 3))
colorbar = ax.collections[0].colorbar
colorbar.set_ticks([0.33, 1, 1.67])
colorbar.set_ticklabels(['0: No interventions', '1: Aim2 intervention', '2: Aim3 intervention'])
详细分解
- 使用
np.where映射Intervention代码:
df‘Aim2C/I’=np.where(df‘Aim2C/I’==‘干预’,1,0) df‘Aim3C/I’=np.where(df‘Aim3C/I’==‘干预’,2,# ID Aim2 Date Aim2 C/I Aim3 Date Aim3 C/I #0 001 9/3/19 1 9/17/19 0#1 002 9/3/19 1 9/19 2#2 003 9/13/19 1 9/27/19 #3 004 9/20/19 0 9/30/19 #4 005 9/23/19 1 10/8/19 0
将
concatDate和C/I列分为长形式:
df = pd.concat([ df['ID','Aim2 Date','Aim2 C/I'].rename(columns={'Aim2 Date':'Date','Aim2 C/I':'C/I'}),df['ID','Aim3 Date','Aim3 C/I‘’].rename(columns={ 'Aim3 Date':'Date',‘Aim3 C/I':'C/I'}),# ID日期C/I #0 001 9/3/19 1#1 002 9/3/19 1#2 003 9/13/19 1#3 004 9/19 1#3 004 9/19 0#4 005 9/19 1#0 001 9/17/19 0#1 002 9/19 2#2 003 9/27/19 #3 004 9/30/19 0#4 005 10/8/19 0
- 将日期创建为列的
pivot_table:
df'Date‘= pd.to_datetime(df'Date').dt.strftime('%Y-%m-%d') df =df.pivot_table(索引=’ID‘,列=’Date‘,fill_value=0).droplevel(0,( axis=1) #日期2019-09-03 2019-09-13 2019-09-17 2019-09-19 2019-09-20 2019-09-23 2019-09-23 2019-09-27 2019-09-30 2009-08# ID # 001 10 0 0 2 1 0 0 0 10 0 00 0 1 0 0 0
- 用discretized colorbar绘制带注释的
heatmap:
ax = sns.heatmap(df,annot=True,cmap=sns.color_palette('cividis',3))彩色条= ax.collections.colorbar colorbar.set_ticks(0.33,1,1.67) colorbar.set_ticklabels('0:无干预‘,'1: Aim2干预’,'2: Aim3 colorbar.set_ticks‘)
https://stackoverflow.com/questions/70239870
复制相似问题
腾讯云开发者

Copyright © 2013 - 2026 Tencent Cloud. All Rights Reserved. 腾讯云 版权所有
深圳市腾讯计算机系统有限公司 ICP备案/许可证号:粤B2-20090059 ![]() 粤公网安备44030502008569号
粤公网安备44030502008569号
腾讯云计算(北京)有限责任公司 京ICP证150476号 | 京ICP备11018762号