LeafLet加载自定义Legend的设计与实现
原创
LeafLet加载自定义Legend的设计与实现
原创
夜郎King
发布于 2026-04-26 09:51:40
发布于 2026-04-26 09:51:40
背景
众所周知,在GIS的世界里,图例和地图永远是一对一起出现的对象。在地图上表示地理环境各要素,比如山脉、河流、城市、铁路等所用的符号叫做图例。这些符号所表示的意义,常注明在地图的边角上。图例是表达地图内容的基本形式和方法,是现代地图的语言,是读图和用读所借助的工具。地图符号一般包括各种大小、粗细、颜色不同的点、线、图形等。符号的设计要能表达地面景物的形状、大小和位置,而且还能反映出各种景物的质和量的特征,以及相互关系。因此图例常设计成与实地景物轮廓相似的几何图形。
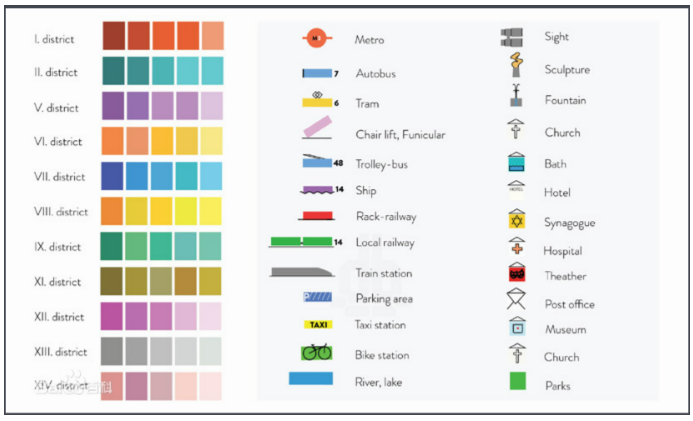
还有一些地图,专门表示各种自然条件、工业分布等。在这些图上,也必然有相应的图例,说明某种符号代表某种森林,某种符号代表某种矿产,某种符号代表某种工业,等等。读图之前,先把图例中的地图符号和注记的意义弄清楚,对于正确理解地图内容就方便多了。可以这样说,图例是读图的“线索”,方便用户按图索骥。
在之前的博文中,介绍了很多Leaflet的内容,关于图例的展示一直没有涉及。本文简单讲讲在Leaflet中如何进行图例的展示,基于Leaflet.Legend进行图例的展示。通过讲解Leaflet.Legend得集成,核心API的讲解,让您对Leaflet.Legend有一个基本的认识和了解。
一、Leaflet.Legend简介
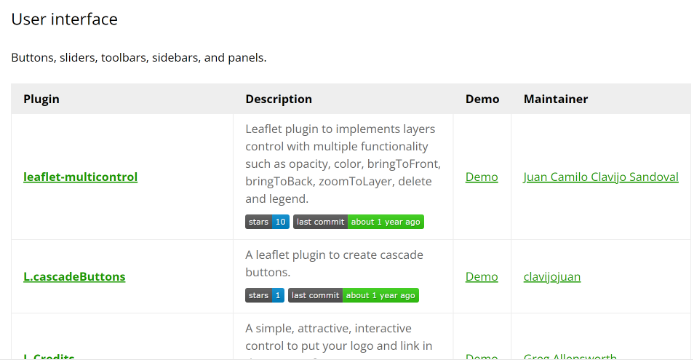
Leaflet本身是一个非常轻量级的前端组件,基于Leaflet有很多的扩展插件,围绕Leaflet的生态非常丰富。在Leaflet中的插件中,可以找到下面的插件列表内容。
1、Legend的开源协议
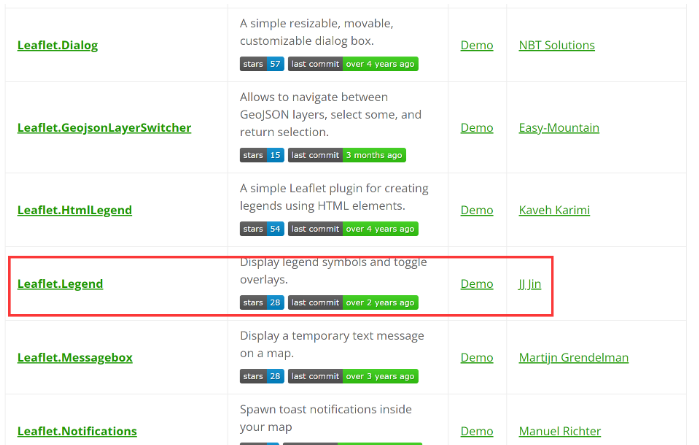
Leaflet.Legend是一个MIT协议,非常宽松的协议。可放心在项目中使用。Leaflet.Legend 是一个 Leaflet 插件, 用于显示图例符号和切换相应的叠加层的显示.开源地址:Legend。
MIT License
Copyright (c) 2020 ptma@163.com
Permission is hereby granted, free of charge, to any person obtaining a copy
of this software and associated documentation files (the "Software"), to deal
in the Software without restriction, including without limitation the rights
to use, copy, modify, merge, publish, distribute, sublicense, and/or sell
copies of the Software, and to permit persons to whom the Software is
furnished to do so, subject to the following conditions:
The above copyright notice and this permission notice shall be included in all
copies or substantial portions of the Software.
THE SOFTWARE IS PROVIDED "AS IS", WITHOUT WARRANTY OF ANY KIND, EXPRESS OR
IMPLIED, INCLUDING BUT NOT LIMITED TO THE WARRANTIES OF MERCHANTABILITY,
FITNESS FOR A PARTICULAR PURPOSE AND NONINFRINGEMENT. IN NO EVENT SHALL THE
AUTHORS OR COPYRIGHT HOLDERS BE LIABLE FOR ANY CLAIM, DAMAGES OR OTHER
LIABILITY, WHETHER IN AN ACTION OF CONTRACT, TORT OR OTHERWISE, ARISING FROM,
OUT OF OR IN CONNECTION WITH THE SOFTWARE OR THE USE OR OTHER DEALINGS IN THE
SOFTWARE.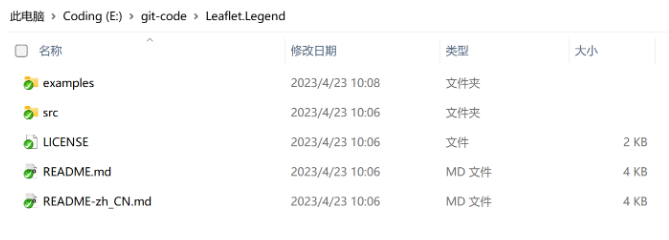
2、Legend API介绍
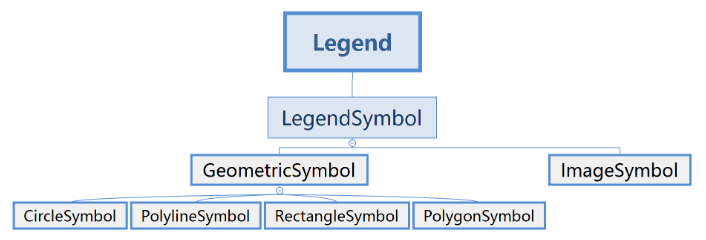
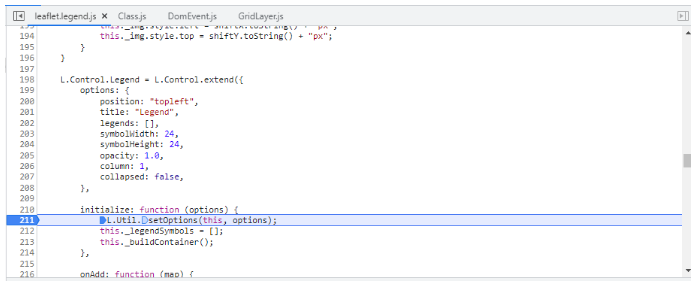
打开src目录下的leaflet.legend.js文件,这里是整个图例类的源码文件,如上图所示的各个Symbol类都定义在这里。下面就这些类进行深入的讲解。
options: {
            position: "topleft",
            title: "Legend",
            legends: [],
            symbolWidth: 24,
            symbolHeight: 24,
            opacity: 1.0,
            column: 1,
            collapsed: false,
        },

        initialize: function (options) {
            L.Util.setOptions(this, options);
            this._legendSymbols = [];
            this._buildContainer();
        },
上述代码定义了创建图例对象的各个属性,具体的参数说明如下:
参数名称 | 类型 | 默认值 | 描述 |
|---|---|---|---|
position | String | topleft | 图例控件位置 |
title | String | Legend | 图例控件的标题 |
opacity | Number | 1.0 | 图例面板的透明度 |
legends | LegendSymbol[] | [] | [LegendSymbol](#legendsymbol) 图例符号数组。 |
symbolWidth | Number | 24 | 图例符号的宽度,以像素为单位 |
symbolHeight | Number | 24 | 图例符号的高度,以像素为单位 |
column | Number | 1 | 图例符号排列的列数 |
collapsed | Boolean | false | 图例面板是否默认展开 |
LegendSymbol对象的定义如下:
参数名称 | 类型 | 默认值 | 描述 |
|---|---|---|---|
label | String | undefined | 图例符号的文本标签。 |
type | String | undefined | 图例符号的类型. 可以是image','circle','rectangle','polygon' 或 'polyline'。 |
url | String | undefined | 图里图片的 URL,仅用于 type 为 'image' 时 |
radius | Number | undefined | 圆形图例的半径,以像素为单位,仅用于 type 为 'circle' 时 |
sides | Number | undefined | 正多边形的边数,仅用于 type 为 'polygon' 时。 |
layers | Layer | Layer[] | undefined,图例符号关联的叠加层. 关联叠加层后可通过点击图例来切换相应叠加层的可见性。 |
inactive | Boolean | undefined | 图例符号是否为非激活的, 非激活的图例会减淡显示 |
stroke | Boolean | true | 是否绘制边框 |
color | String | #3388ff | 边框颜色 |
weight | Number | 3 | 边框宽度 |
opacity | Number | 1.0 | 边框透明度 |
lineCap | String | round | 指定如何绘制每一条线段末端的属性。有 3 个可能的值,分别是:'butt','round' 或 ’square‘ |
lineJoin | String | round | 用来设置2个长度不为0的相连部分(线段,圆弧,曲线)如何连接在一起的属性(长度为0的变形部分,其指定的末端和控制点在同一位置,会被忽略) |
dashArray | String | null | 控制用来描边的点划线的图案范式 |
dashOffset | String | null | dash模式到路径开始的距离 |
fill | Boolean | depends | 是否用颜色填充 |
fillColor | String | * | 填充色,默认与边框颜色相同 |
fillOpacity | Number | 0.2 | 填充透明度 |
fillRule | String | evenodd | 填充规则 |
二、Legend实例开发
有了上面对图例API的基础认知之后,我们便可以进行相应的实例开发。下面将使用一个详细的案例讲解,来详细说明Legend如何进行深入开发。
1、新建html页面
<!DOCTYPE html>
<html>

<head>
    <title>Leaflet legend control</title>
    <meta charset="utf-8" />
    <style type="text/css">
        body {
            padding: 0;
            margin: 0;
        }

        html,
        body,
        #map {
            height: 100%;
        }

    </style>
    <link rel="stylesheet" href="https://unpkg.com/leaflet@1.7.1/dist/leaflet.css" />
    <script src="https://unpkg.com/leaflet@1.7.1/dist/leaflet.js"></script>

    <link rel="stylesheet" href="../src/leaflet.legend.css" />
    <script type="text/javascript" src="../src/leaflet.legend.js"></script>
</head>

<body>
    <div id="map"></div>
</body>
</html>
2、创建Leaflet对象引用
var map = L.map("map", {
    center: [29.797751134173065, 120.7012939453125],
    zoom: 5
});

L.tileLayer('file:///D%3A/wzh_test/q0403/{z}/{x}/{y}.png', {
    minZoom: 0,
    maxZoom: 7,
    tms: false,
    attribution: '图例功能测试-夜郎king'
}).addTo(map);
3、图例定义
var marker = L.circleMarker(L.latLng(29.702368038541767, 120.47607421874999), {
radius: 6,
fillColor: "#ff0000",
color: "blue",
weight: 2,
opacity: 1,
fillOpacity: 0.6,
});
var latlngs = [
[
29.204918463909035,
119.6246337890625,
],
[
29.79358002272772,
120.27008056640624,
],
[
29.70087695780884,
120.2984046936035,
]
];
var polyline = L.polyline(latlngs, {
color: 'red'
}).addTo(map);
const legend = L.control.Legend({
position: "bottomleft",
collapsed: false,
symbolWidth: 24,
opacity: 1,
title:"图例",
column: 2,
legends: [{
label: "位置",
type: "image",
url: "marker/marker-red.png",
}, {
label: "Marker2",
type: "image",
url: "marker/purple.png"
}, {
label: "Circle",
type: "circle",
radius: 6,
color: "blue",
fillColor: "#FF0000",
fillOpacity: 0.6,
weight: 2,
layers: [marker],
inactive: true,
}, {
label: "Real line",
type: "polyline",
color: "#FF0000",
fillColor: "#FF0000",
weight: 2,
layers: polyline
}, {
label: "Dotted line",
type: "polyline",
color: "#0000FF",
fillColor: "#0000FF",
dashArray: [5, 5],
weight: 2
}, {
label: "Rectangle",
type: "rectangle",
color: "#FF0000",
fillColor: "#FF0000",
weight: 2
}, {
label: "Square",
type: "polygon",
sides: 4,
color: "#FF0000",
fillColor: "#FF0000",
weight: 2
}, {
label: "Regular triangle",
type: "polygon",
sides: 3,
color: "#FF0000",
fillColor: "#FF0000",
weight: 2
}, {
label: "Regular polygon",
type: "polygon",
sides: 5,
color: "#FF0000",
fillColor: "#FF0000",
weight: 2
}]
})
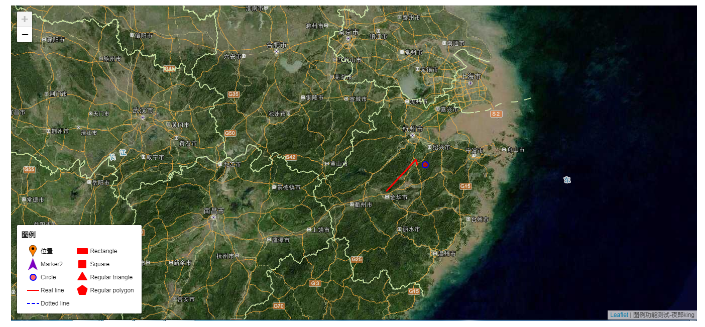
.addTo(map);4、展示效果
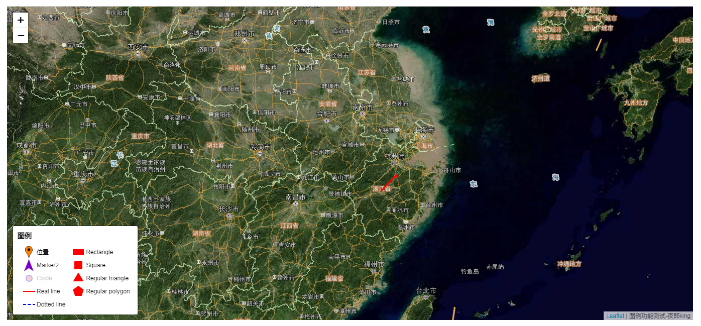
点击Circle图例还可以进行图层的切换,默认情况下,地图上不展示这些信息,点击之后会在地图上添加相应的图层对象。
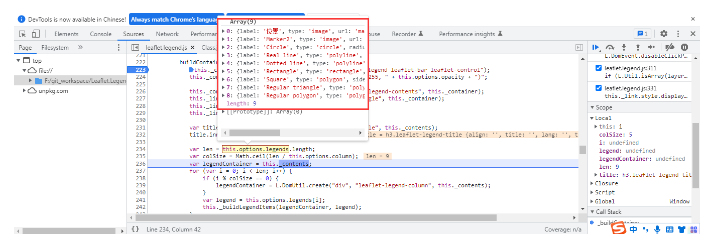
5、图例调用过程
在源码中进行debug调试,观察相应的代码如何执行的。首先进行Legend初始化,调用initialize方法,在这个方法中会将出入的参数进行解析,然后再创建元素对象。
_buildContainer: function () {
            this._container = L.DomUtil.create("div", "leaflet-legend leaflet-bar leaflet-control");
            this._container.style.backgroundColor = "rgba(255,255,255, " + this.options.opacity + ")";

            this._contents = L.DomUtil.create("section", "leaflet-legend-contents", this._container);
            this._link = L.DomUtil.create("a", "leaflet-legend-toggle", this._container);
            this._link.title = "Legend";
            this._link.href = "#";

            var title = L.DomUtil.create("h3", "leaflet-legend-title", this._contents);
            title.innerText = this.options.title || "Legend";

            var len = this.options.legends.length;
            var colSize = Math.ceil(len / this.options.column);
            var legendContainer = this._contents;
            for (var i = 0; i < len; i++) {
                if (i % colSize == 0) {
                    legendContainer = L.DomUtil.create("div", "leaflet-legend-column", this._contents);
                }
                var legend = this.options.legends[i];
                this._buildLegendItems(legendContainer, legend);
            }
        },
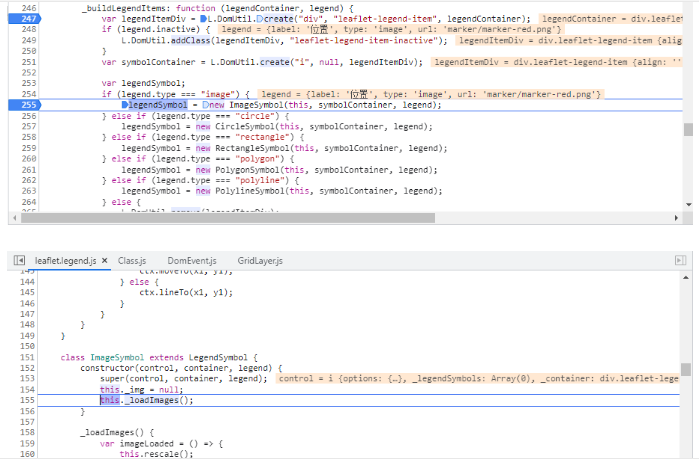
在上面的代码执行过程中定义相应的图例对象,同时将对象放置到页面元素中。下面重点看一下各个图例对象是怎么进行初始化的。
_buildLegendItems: function (legendContainer, legend) {
            var legendItemDiv = L.DomUtil.create("div", "leaflet-legend-item", legendContainer);
            if (legend.inactive) {
                L.DomUtil.addClass(legendItemDiv, "leaflet-legend-item-inactive");
            }
            var symbolContainer = L.DomUtil.create("i", null, legendItemDiv);

            var legendSymbol;
            if (legend.type === "image") {
                legendSymbol = new ImageSymbol(this, symbolContainer, legend);
            } else if (legend.type === "circle") {
                legendSymbol = new CircleSymbol(this, symbolContainer, legend);
            } else if (legend.type === "rectangle") {
                legendSymbol = new RectangleSymbol(this, symbolContainer, legend);
            } else if (legend.type === "polygon") {
                legendSymbol = new PolygonSymbol(this, symbolContainer, legend);
            } else if (legend.type === "polyline") {
                legendSymbol = new PolylineSymbol(this, symbolContainer, legend);
            } else {
                L.DomUtil.remove(legendItemDiv);
                return;
            }
            this._legendSymbols.push(legendSymbol);

            symbolContainer.style.width = this.options.symbolWidth + "px";
            symbolContainer.style.height = this.options.symbolHeight + "px";

            var legendLabel = L.DomUtil.create("span", null, legendItemDiv);
            legendLabel.innerText = legend.label;
            if (legend.layers) {
                L.DomUtil.addClass(legendItemDiv, "leaflet-legend-item-clickable");
                L.DomEvent.on(
                    legendItemDiv,
                    "click",
                    function () {
                        this._toggleLegend.call(this, legendItemDiv, legend.layers);
                    },
                    this
                );
            }
        },
以上就是Legend图例对象的主要执行过程,有兴趣的朋友可以把源码clone到本地进行深入研究。
总结
以上就是本文的主要内容,本文简单讲解在Leaflet中如何进行图例的展示。通过讲解Leaflet.Legend的集成,核心API的讲解,让您对Leaflet.Legend有一个基本的认识和了解。本文行文仓促,难免有误,欢迎批评指正。
原创声明:本文系作者授权腾讯云开发者社区发表,未经许可,不得转载。
如有侵权,请联系 cloudcommunity@tencent.com 删除。
原创声明:本文系作者授权腾讯云开发者社区发表,未经许可,不得转载。
如有侵权,请联系 cloudcommunity@tencent.com 删除。
评论
登录后参与评论
推荐阅读
目录
腾讯云开发者

Copyright © 2013 - 2026 Tencent Cloud. All Rights Reserved. 腾讯云 版权所有
深圳市腾讯计算机系统有限公司 ICP备案/许可证号:粤B2-20090059 ![]() 粤公网安备44030502008569号
粤公网安备44030502008569号
腾讯云计算(北京)有限责任公司 京ICP证150476号 | 京ICP备11018762号