如何量化识别股票底部形态(二)


上一篇文章写 如何量化识别股票底部形态(一) , 这篇文章继续写下其他底部形态。 比如头肩底,圆弧底。
三、头肩底:最可靠的“大底信号”
1. 形态定义与特征
头肩底是“反转形态之王”,由左肩、头部、右肩和颈线组成,形似“倒立的人体”。其核心特征:
- 头部最低:中间的“头部”低点必须低于左肩和右肩的低点;
- 左肩≈右肩:左肩和右肩的低点价格、形成时间尽可能对称;
- 颈线倾斜:颈线连接左肩反弹高点与头部反弹高点,通常向右上方倾斜(更强势);
- 放量突破:突破颈线时成交量需显著放大(较前5日平均成交量高30%以上)。
2. 市场含义
头肩底是“三重探底”过程:左肩是空方第一次打压,头部是空方最后疯狂(但未创新低),右肩是多方反攻确认。突破颈线意味着长期下跌趋势终结,新一轮上涨趋势开启。
3. 写一个例子演示下
import pandas as pd
import akshare as ak
def find_head_shoulders_bottom(df, min_distance=10, price_tolerance=0.08, volume_ratio=1.3):
    # 第一步:找出所有局部低点(低点比前后3天都低)
    df['局部低点'] = False
    for i in range(3, len(df) - 3):
        if df['最低'].iloc[i] == df['最低'].iloc[i - 3:i + 3].min():
            df.at[df.index[i], '局部低点'] = True
    local_lows = df[df['局部低点']]
    hsb_patterns = []
    # 第二步:遍历可能的“头部”(中间低点)
    for i in range(1, len(local_lows) - 1):
        head = local_lows.iloc[i]  # 头部
        left_shoulder = local_lows.iloc[i - 1]  # 左肩
        right_shoulder = local_lows.iloc[i + 1]  # 右肩
        # 条件1:头部是最低点
        if (head['最低'] >= left_shoulder['最低']) or (head['最低'] >= right_shoulder['最低']):
            continue
        # 条件2:左肩与右肩价格相近
        shoulder_price_diff = abs(left_shoulder['最低'] - right_shoulder['最低']) / left_shoulder['最低']
        if shoulder_price_diff > price_tolerance:
            continue
        # 条件3:时间间隔合理(头部与左右肩间隔≥min_distance天)
        left_days = (head.name - left_shoulder.name).days
        right_days = (right_shoulder.name - head.name).days
        if (left_days < min_distance) or (right_days < min_distance):
            continue
        # 条件4:计算颈线(左肩高点与头部高点的连线)
        left_shoulder_high = df[df.index == left_shoulder.name]['最高'].values[0]
        head_high = df[df.index == head.name]['最高'].values[0]
        # 颈线方程:y = kx + b(x为日期序号,y为价格)
        left_x = df.index.get_loc(left_shoulder.name)
        head_x = df.index.get_loc(head.name)
        k = (head_high - left_shoulder_high) / (head_x - left_x)
        b = left_shoulder_high - k * left_x
        # 条件5:右肩形成后,股价突破颈线(且放量)
        right_shoulder_x = df.index.get_loc(right_shoulder.name)
        after_right_shoulder = df.iloc[right_shoulder_x + 1:]
        if len(after_right_shoulder) == 0:
            continue
        # 计算突破日的颈线价格
        after_right_shoulder['颈线价格'] = k * after_right_shoulder.index.map(lambda x: df.index.get_loc(x)) + b
        breakout_signals = after_right_shoulder[
            (after_right_shoulder['收盘'] > after_right_shoulder['颈线价格'] * 1.03) &  # 突破3%
            (after_right_shoulder['成交量'] > after_right_shoulder['成交量'].rolling(5).mean() * volume_ratio)  # 放量
            ]
        if len(breakout_signals) > 0:
            hsb_patterns.append({
                '左肩日期': left_shoulder.name,
                '左肩价格': left_shoulder['最低'],
                '头部日期': head.name,
                '头部价格': head['最低'],
                '右肩日期': right_shoulder.name,
                '右肩价格': right_shoulder['最低'],
                '颈线突破日期': breakout_signals.index[0],
                '突破收盘价': breakout_signals['收盘'].iloc[0]
            })
    return hsb_patterns
# 获取股票数据(以平安银行000001为例)
def get_stock_data(symbol="000001", start_date="20250101", end_date="20250921"):
    df = ak.stock_zh_a_hist(symbol=symbol, period="daily",
                            start_date=start_date, end_date=end_date, adjust="qfq")
    df['日期'] = pd.to_datetime(df['日期'])
    df.set_index('日期', inplace=True)
    return df[['开盘', '收盘', '最高', '最低', '成交量']]
# 执行识别(以中国平安6013182022年数据为例)
df_pingan = get_stock_data(symbol="601318", start_date="20250101", end_date="20250921")
hsb_patterns = find_head_shoulders_bottom(df_pingan)
if hsb_patterns:
    for pattern in hsb_patterns:
        print(f"头肩底确认:\n左肩:{pattern['左肩日期']}(价格:{pattern['左肩价格']:.2f})")
        print(f"头部:{pattern['头部日期']}(价格:{pattern['头部价格']:.2f})")
        print(f"右肩:{pattern['右肩日期']}(价格:{pattern['右肩价格']:.2f})")
        print(f"颈线突破日期:{pattern['颈线突破日期']}(突破价:{pattern['突破收盘价']:.2f})\n")
else:
    print("未识别出符合条件的头肩底形态")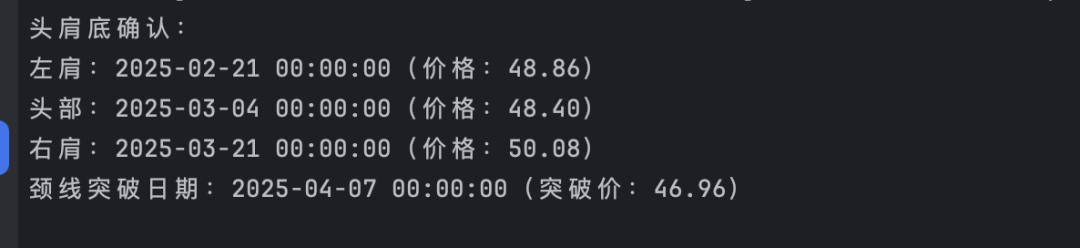
四、圆弧底:温和反转的“蓄势形态”
1. 形态定义与特征
圆弧底,又称“碗底”,是股价缓慢下跌后缓慢上涨,形成的“半圆弧”形态。其核心特征:
- 下跌/上涨对称:左侧下跌时间与右侧上涨时间大致相等(比例1:1~1:1.5);
- 成交量圆弧状:左侧下跌时成交量逐渐萎缩,右侧上涨时逐渐放大,整体呈“碗状”;
- 低点不创新低:形态内最低点仅出现一次,且后续低点逐步抬高。
2. 市场含义
圆弧底是“温和筑底”形态,多出现在绩优股或大盘股中。主力资金通过长时间缓慢吸筹,避免引起市场关注,一旦突破圆弧底上沿,往往会开启长期上涨行情。
3. 写一个例子演示下
import numpy as np
import pandas as pd
import akshare as ak
#圆弧底
def find_rounding_bottom(df, window=50, min_curve_ratio=0.3):
    # 第一步:计算滚动最低点(用于识别圆弧的低点区域)
    df['滚动最低'] = df['最低'].rolling(window=window, center=True).min()
    # 第二步:识别圆弧底候选区域(滚动最低点在中间区域)
    df['候选区域'] = False
    for i in range(window // 2, len(df) - window // 2):
        current_low = df['最低'].iloc[i]
        # 当前低点是window周期内的最低点,且位于中间1/3区域
        if current_low == df['最低'].iloc[i - window // 2:i + window // 2].min():
            df.at[df.index[i], '候选区域'] = True
    candidate_lows = df[df['候选区域']]
    rounding_bottoms = []
    # 第三步:验证候选区域是否符合圆弧底特征
    for i in range(len(candidate_lows)):
        low_point = candidate_lows.iloc[i]
        low_date = low_point.name
        low_idx = df.index.get_loc(low_date)
        # 确定左侧(下跌)和右侧(上涨)范围
        left_start = max(0, low_idx - window // 2)
        right_end = min(len(df) - 1, low_idx + window // 2)
        left_df = df.iloc[left_start:low_idx]
        right_df = df.iloc[low_idx:right_end]
        if (len(left_df) < 10) or (len(right_df) < 10):
            continue
        # 条件1:左侧下跌(低点逐步降低),右侧上涨(低点逐步抬高)
        left_lows = left_df['最低'].values
        right_lows = right_df['最低'].values
        # 左侧:线性回归斜率为负(下跌趋势)
        left_x = np.arange(len(left_lows))
        left_slope = np.polyfit(left_x, left_lows, 1)[0]
        # 右侧:线性回归斜率为正(上涨趋势)
        right_x = np.arange(len(right_lows))
        right_slope = np.polyfit(right_x, right_lows, 1)[0]
        if (left_slope >= 0) or (right_slope <= 0):
            continue
        # 条件2:成交量呈圆弧状(左侧萎缩,右侧放大)
        left_volume = left_df['成交量'].values
        right_volume = right_df['成交量'].values
        # 左侧成交量均值 < 右侧成交量均值
        if np.mean(left_volume) >= np.mean(right_volume):
            continue
        # 条件3:圆弧曲率足够(低点与两端连线的距离占比)
        left_high = left_df['最高'].max()
        right_high = right_df['最高'].max()
        chord_high = max(left_high, right_high)
        curve_depth = chord_high - low_point['最低']
        curve_ratio = curve_depth / chord_high
        if curve_ratio < min_curve_ratio:
            continue
        rounding_bottoms.append({
            '圆弧低点日期': low_date,
            '低点价格': low_point['最低'],
            '左侧交易日': len(left_df),
            '右侧交易日': len(right_df),
            '曲率深度比例': curve_ratio
        })
    return rounding_bottoms
# 获取股票数据(以平安银行000001为例)
def get_stock_data(symbol="000001", start_date="20250101", end_date="20250921"):
    df = ak.stock_zh_a_hist(symbol=symbol, period="daily",
                            start_date=start_date, end_date=end_date, adjust="qfq")
    df['日期'] = pd.to_datetime(df['日期'])
    df.set_index('日期', inplace=True)
    return df[['开盘', '收盘', '最高', '最低', '成交量']]
# 执行识别
df_zhaoshang = get_stock_data(symbol="600036", start_date="20220101", end_date="20250921")
rounding_bottoms = find_rounding_bottom(df_zhaoshang)
if rounding_bottoms:
    for rb in rounding_bottoms:
        print(f"圆弧底确认:\n低点日期:{rb['圆弧低点日期']}(价格:{rb['低点价格']:.2f})")
        print(f"左侧下跌周期:{rb['左侧交易日']}天,右侧上涨周期:{rb['右侧交易日']}天")
        print(f"曲率深度比例:{rb['曲率深度比例']:.2%}\n")
else:
    print("未识别出符合条件的圆弧底形态")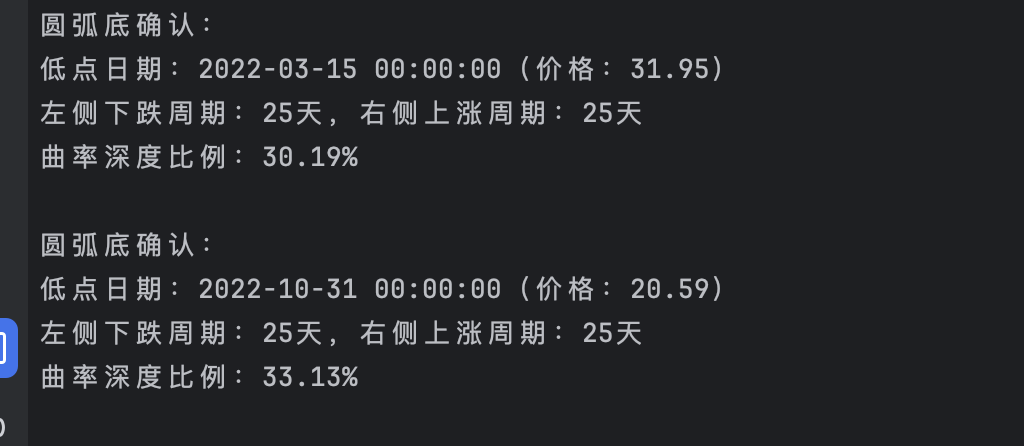
如果我的分享对你投资有所帮助,不吝啬给个点赞关注呗。
本文参与 腾讯云自媒体同步曝光计划,分享自微信公众号。
原始发表:2025-09-23,如有侵权请联系 cloudcommunity@tencent.com 删除
评论
登录后参与评论
推荐阅读
目录
腾讯云开发者

Copyright © 2013 - 2026 Tencent Cloud. All Rights Reserved. 腾讯云 版权所有
深圳市腾讯计算机系统有限公司 ICP备案/许可证号:粤B2-20090059 ![]() 粤公网安备44030502008569号
粤公网安备44030502008569号
腾讯云计算(北京)有限责任公司 京ICP证150476号 | 京ICP备11018762号