[转]PostgreSQL定位函数中最耗时的SQL


最近在排查数仓的PostgreSQL慢SQL的时候,在网上看到这篇文章很有帮助,于是转来过来。
一、 问题背景
开发反馈pg中某函数执行时间很长,超过30分钟,想看看慢在其中哪一段SQL。但是如果直接通过pg_stat_activity查询,只能看到上层执行函数的语句,而不像oracle和SqlServer能看到当前在执行什么。咨询群友们得到了几种方法,下面测试和对比一下。
简单模拟如下:
create table test(id int);
INSERT INTO test(id) VALUES (generate_series(1, 10000));

create table test2(id int);
INSERT INTO test2(id) VALUES (generate_series(1, 10000));

create or replace function test_f() returns int
as $$
select count(*) from test;
select count(*) from test2;
select count(*) from test,test2;
$$
language sql;
执行函数
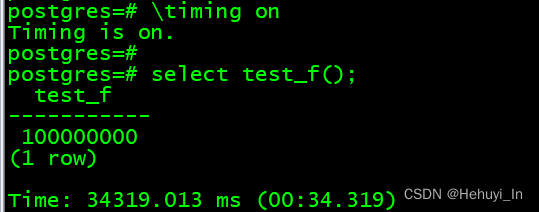
查看运行情况
select
pid,
usename,
substring(query from 0 for 50),
now()-query_start as time,
wait_event_type,
wait_event
from pg_stat_activity where state = 'active';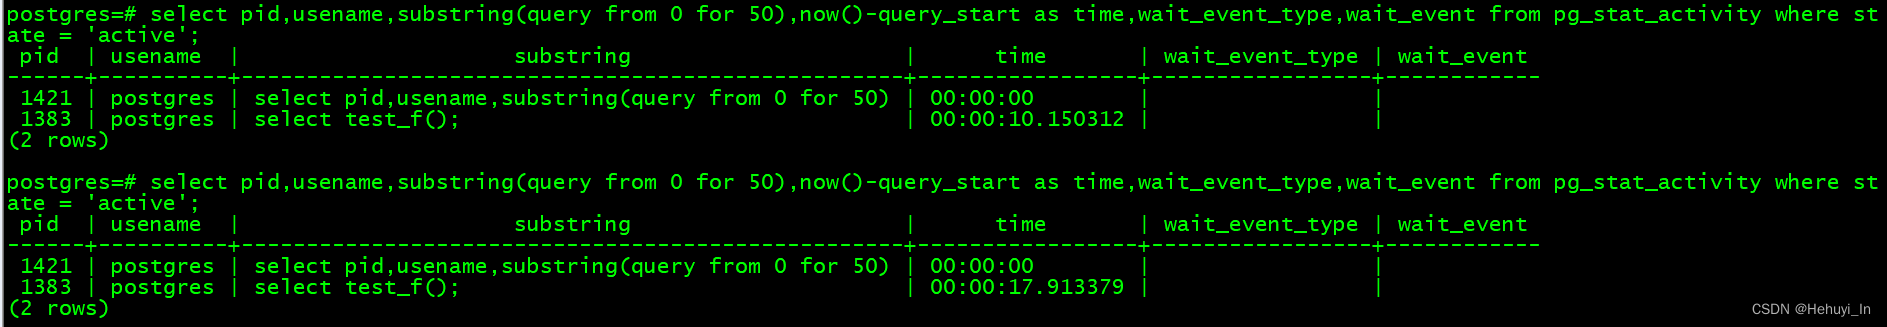
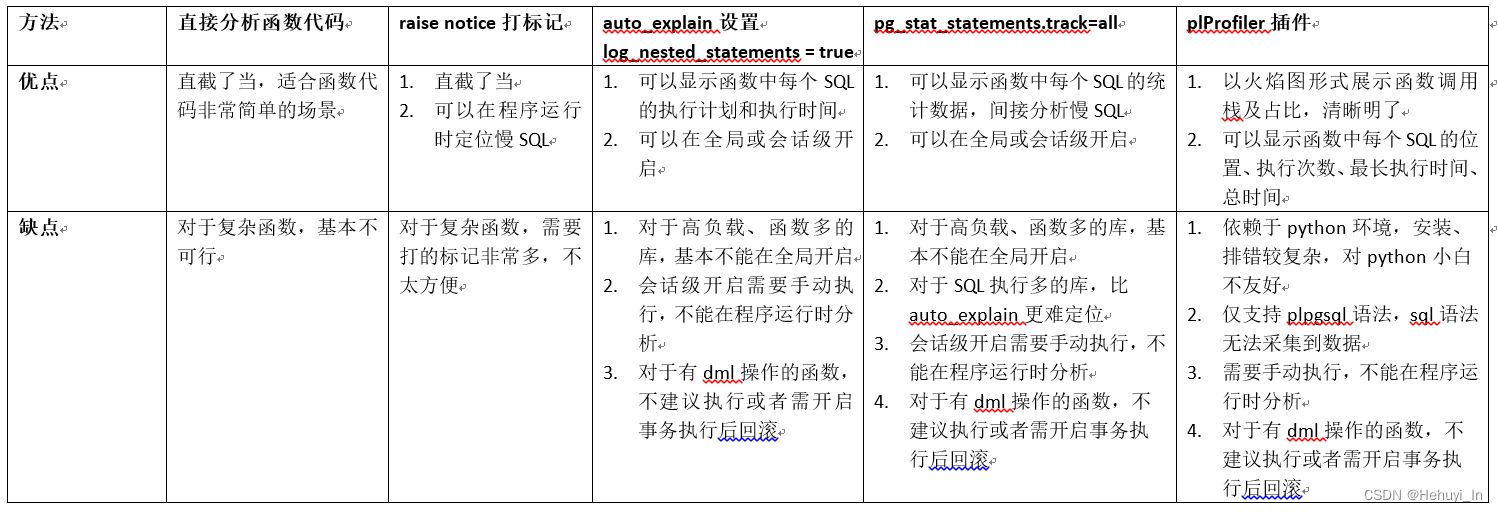
二、 方法汇总及对比
附上之前记录的Oracle和SQL Server的定位方法:
Oracle存储过程定位慢SQL方法_oracle 慢sql_Hehuyi_In的博客-CSDN博客
SQL Server 如何找到存储过程中最耗时的部分_Hehuyi_In的博客-CSDN博客
以下为各类方法的测试效果
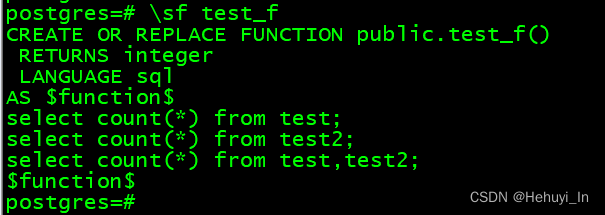
三、 直接分析函数代码
\sf 函数名 可以查看函数代码,这适用于函数非常简单的场景,例如我们的例子
如果函数中SQL很长,输出可能会错行,不方便分析,可以用psql将其导出成文本。
psql -c "\sf test_f" > test_f.sqlbash四、 raise notice打标记
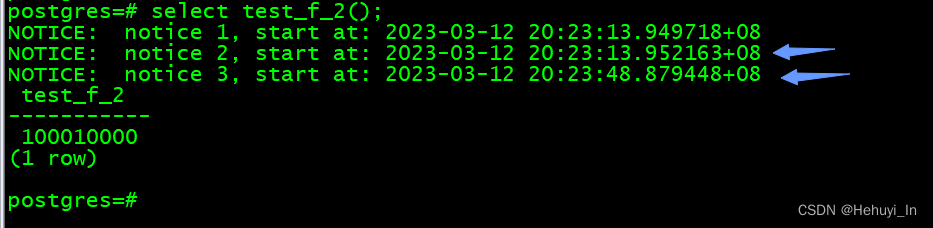
注意raise要用plpgsql语言,像上面用sql会报错,为方便测试稍微做点改造。
CREATE OR REPLACE FUNCTION test_f_2() RETURNS integer AS $$

declare

num int;

BEGIN

raise notice 'notice 1, start at: %',clock_timestamp();

insert into test select count(*) from test;

raise notice 'notice 2, start at: %',clock_timestamp();

select count(*) into num from test,test2;

raise notice 'notice 3, start at: %',clock_timestamp();

insert into test2 select count(*) from test2;

return num;

END;

$$ LANGUAGE plpgsql;
输出如下
五、 auto_explain显示每个SQL执行计划
对于业务量大的库,不适合全局抓取SQL,可以在客户端 开启 。设置以下参数,核心是log_nested_statements = true,展示函数内所有SQL执行计划。
LOAD 'auto_explain';

set client_min_messages='log';

set auto_explain.log_min_duration = 0;

set auto_explain.log_analyze = true;

set auto_explain.log_verbose = true;

set auto_explain.log_buffers = true;

set auto_explain.log_nested_statements = true;
效果如下
postgres=# select test_f();
------------- SQL 1执行时间
LOG: duration: 3.000 ms plan:
Query Text:
select count(*) from test;
select count(*) from test2;
select count(*) from test,test2;
Aggregate (cost=170.00..170.01 rows=1 width=8) (actual time=2.998..2.999 rows=1 loops=1)
Output: count(*)
Buffers: shared hit=45
-> Seq Scan on public.test (cost=0.00..145.00 rows=10000 width=0) (actual time=0.007..1.506 rows=10000 loops=1)
Output: id
Buffers: shared hit=45
------------- SQL 2执行时间
LOG: duration: 2.924 ms plan:
Query Text:
select count(*) from test;
select count(*) from test2;
select count(*) from test,test2;
Aggregate (cost=170.00..170.01 rows=1 width=8) (actual time=2.923..2.923 rows=1 loops=1)
Output: count(*)
Buffers: shared hit=45
-> Seq Scan on public.test2 (cost=0.00..145.00 rows=10000 width=0) (actual time=0.007..1.450 rows=10000 loops=1)
Output: id
Buffers: shared hit=45
------------- SQL 3执行时间(可以看到占比最大)
LOG: duration: 48553.037 ms plan:
Query Text:
select count(*) from test;
select count(*) from test2;
select count(*) from test,test2;
Aggregate (cost=1500315.00..1500315.01 rows=1 width=4) (actual time=48553.031..48553.033 rows=1 loops=1)
Output: count(*)
Buffers: shared hit=90
-> Nested Loop (cost=0.00..1250315.00 rows=100000000 width=0) (actual time=0.013..33346.371 rows=100000000 loops=1)
Buffers: shared hit=90
-> Seq Scan on public.test (cost=0.00..145.00 rows=10000 width=0) (actual time=0.006..19.550 rows=10000 loops=1)
Output: test.id
Buffers: shared hit=45
-> Materialize (cost=0.00..195.00 rows=10000 width=0) (actual time=0.000..1.126 rows=10000 loops=10000)
Buffers: shared hit=45
-> Seq Scan on public.test2 (cost=0.00..145.00 rows=10000 width=0) (actual time=0.005..1.944 rows=10000 loops=1)
Buffers: shared hit=45
------------- 总执行时间
LOG: duration: 48559.722 ms plan:
Query Text: select test_f();
Result (cost=0.00..0.26 rows=1 width=4) (actual time=48559.714..48559.715 rows=1 loops=1)
Output: test_f()
Buffers: shared hit=180
test_f
-----------
100000000
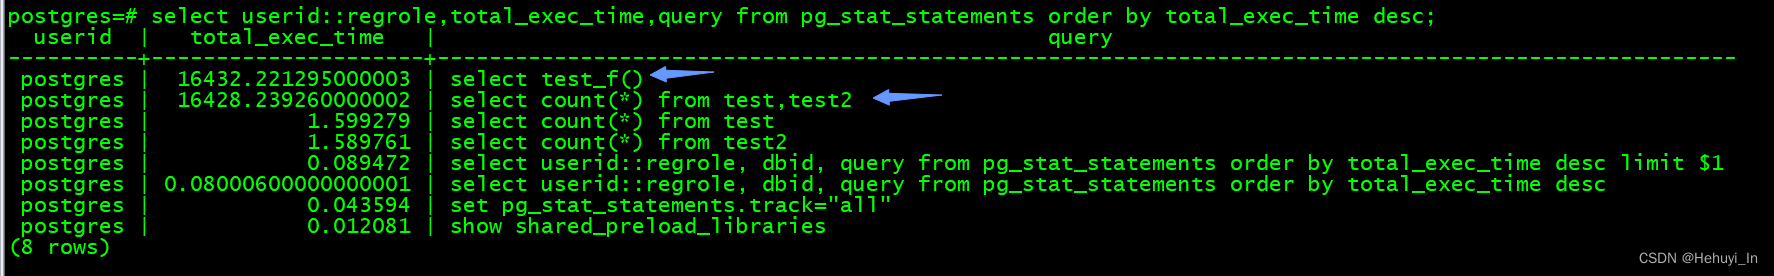
row六、 设置pg_stat_statements.track=all
基本上也只适合客户端开启,或者在测试环境reset后单独跑,比auto_explain更难找
七、 使用plprofiler 插件
流程及排错较为复杂,单独开一篇记录
PostgreSQL定位函数中最耗时的SQL(2)—— plProfiler插件图形化展示耗时语句_Hehuyi_In的博客-CSDN博客
参考
https:// blog .csdn.net/weixin_39540651/article/details/106189705
PostgreSQL: Documentation: 14: F.30. pg_stat_statements
https://www.postgresql.org/ docs /14/plpgsql-structure.html
本文系转载,前往查看
如有侵权,请联系 cloudcommunity@tencent.com 删除。
本文系转载,前往查看
如有侵权,请联系 cloudcommunity@tencent.com 删除。
评论
登录后参与评论
推荐阅读
目录
腾讯云开发者

Copyright © 2013 - 2026 Tencent Cloud. All Rights Reserved. 腾讯云 版权所有
深圳市腾讯计算机系统有限公司 ICP备案/许可证号:粤B2-20090059 ![]() 粤公网安备44030502008569号
粤公网安备44030502008569号
腾讯云计算(北京)有限责任公司 京ICP证150476号 | 京ICP备11018762号