一行代码绘制9幅统计图表,这个可视化工具有点东西...

一行代码绘制9幅统计图表,这个可视化工具有点东西...

DataCharm
发布于 2024-03-26 16:30:35
发布于 2024-03-26 16:30:35
「spiro」-提供快速、标准化和可重复的数据工作流程
今天继续给大家推荐优秀的数据可视化工具-「spiro」
这个工具的用途比较简单,主要为为心肺运动测试数据提供了一个快速、标准化和可重复的工作流程。
它提供了数据导入、处理、汇总和数据可视化展示工具。这里我们重点介绍其数据可视化功能。
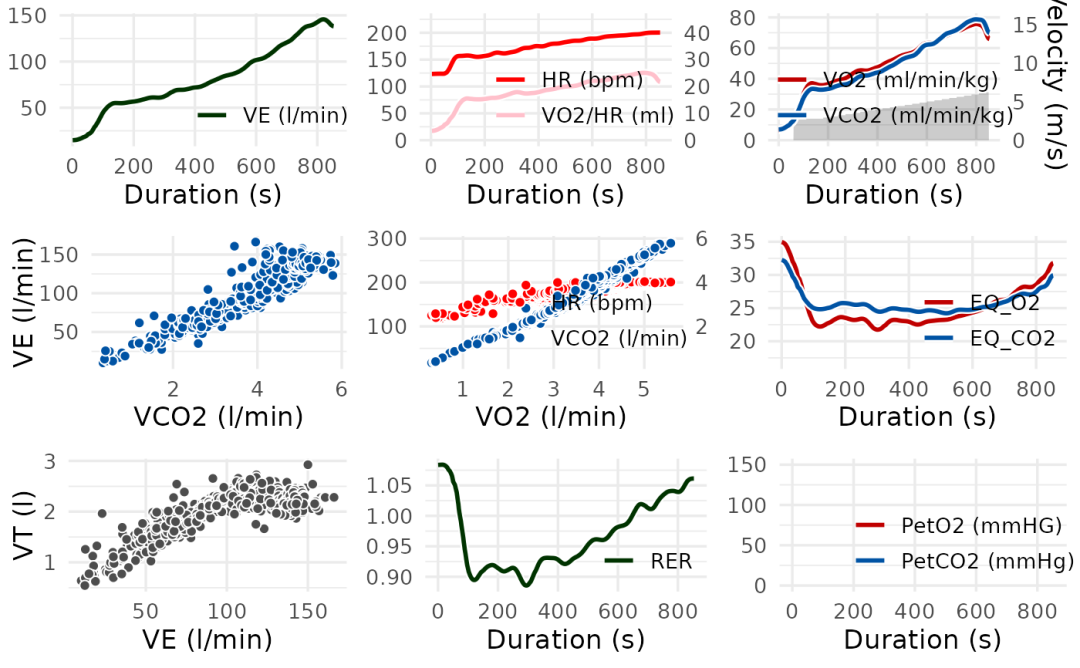
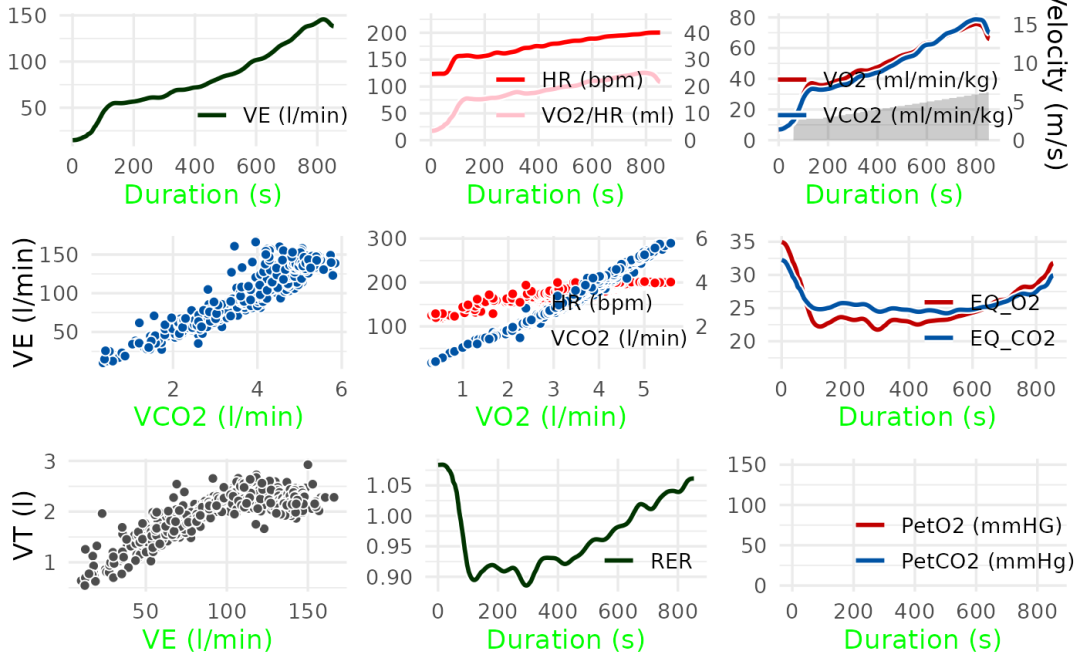
spiro包的数据可视化功能主要依赖其spiro_plot() 函数。下面就列举几个案例:
# \donttest{
# Import and process example data
ramp_data <- spiro(
  file = spiro_example("zan_ramp"),
  hr_file = spiro_example("hr_ramp.tcx")
)

# Display the traditional Wasserman 9-Panel Plot
spiro_plot(ramp_data)


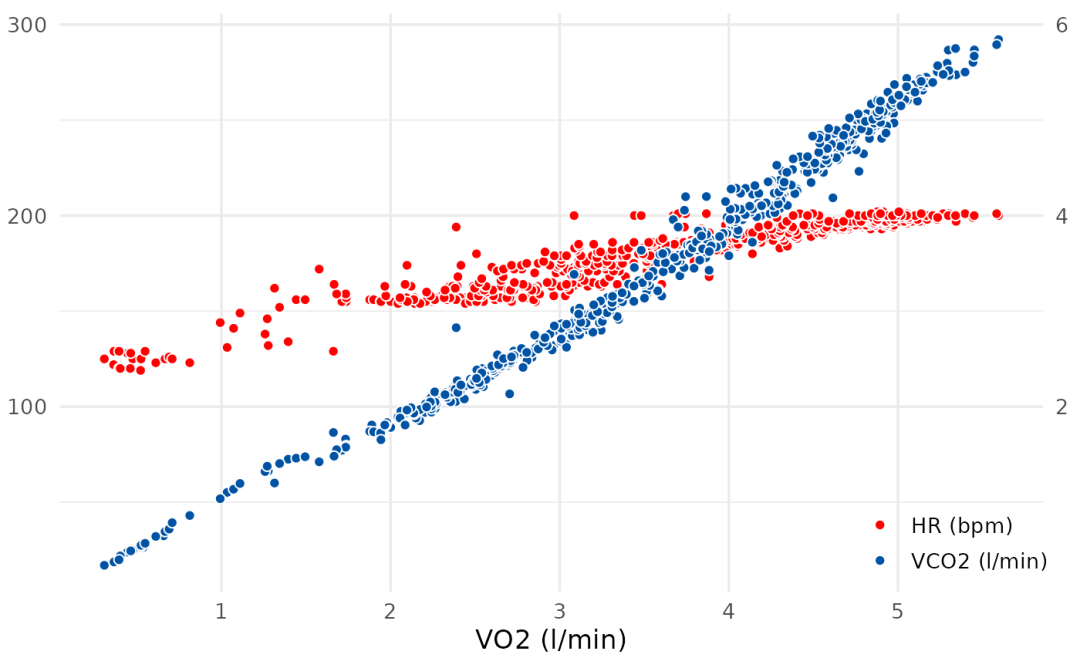
# Display selected panels, here V-Slope
spiro_plot(ramp_data, which = 5)


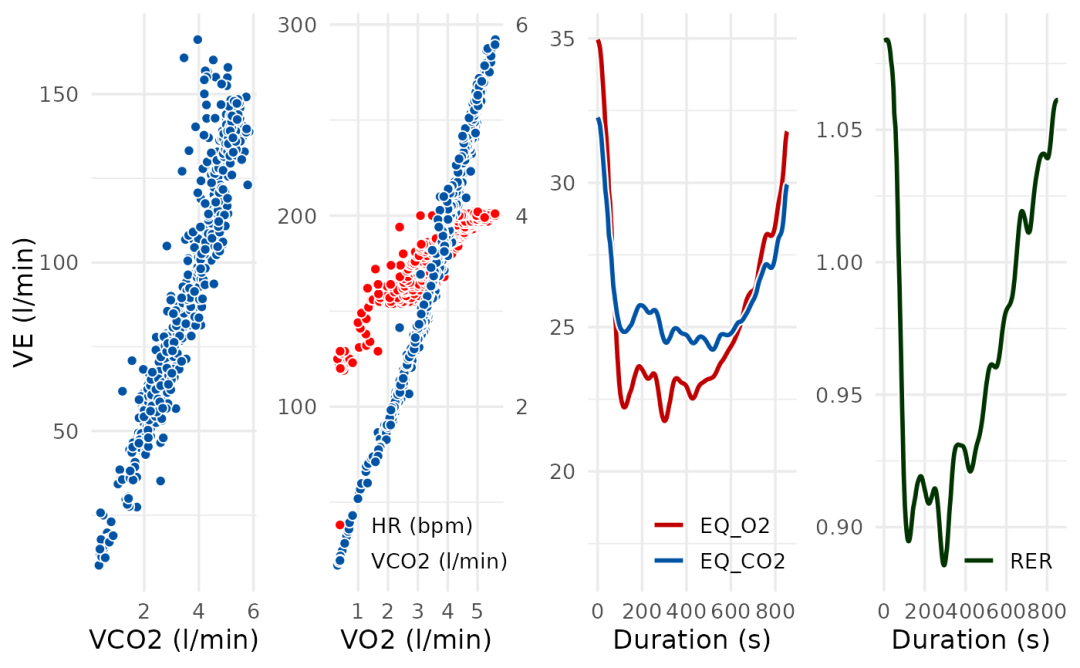
# Modify the arrangement of plots by passing arguments to
# cowplot::plot_grid() via the grid_args argument
spiro_plot(ramp_data, which = c(4, 5, 6, 8), grid_args = list(nrow = 1))


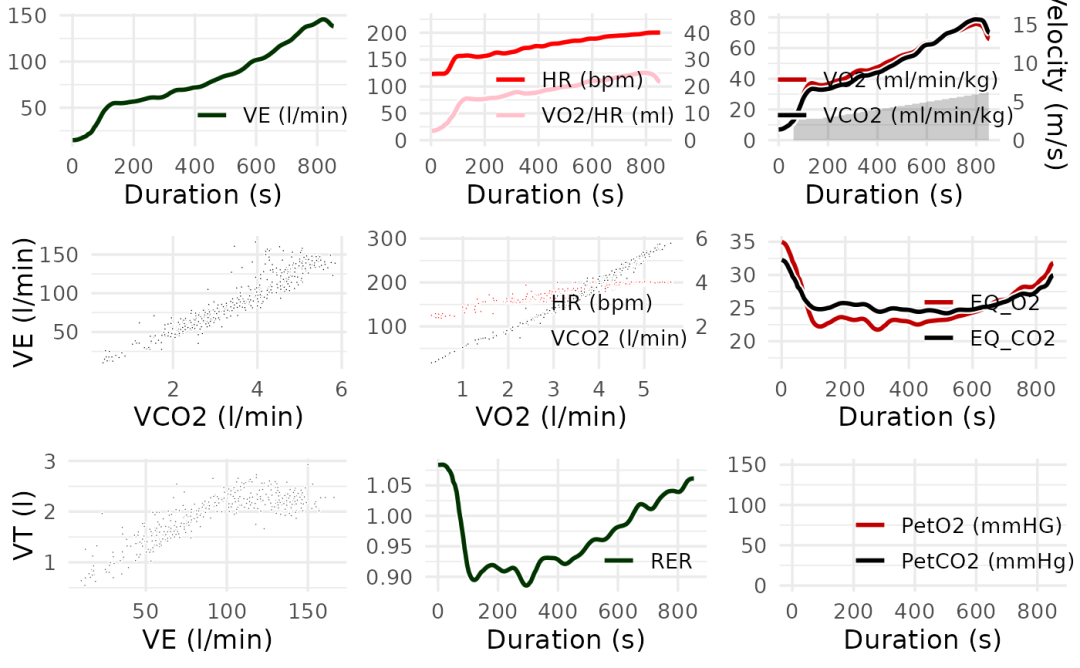
# Modify the appearance of plots using the style_args argument
spiro_plot(ramp_data, style_args = list(size = 0.3, color_VCO2 = "black"))


# Modify the appearance of plots by passing arguments to ggplot2::theme() via
# the style_args argument
spiro_plot(ramp_data,
  style_args = list(axis.title.x = ggplot2::element_text(colour = "green"))
)

# }
spiro_plot(ramp_data, which = 5)
spiro_plot(ramp_data, which = c(4, 5, 6, 8), grid_args = list(nrow = 1))
spiro_plot(ramp_data, style_args = list(size = 0.3, color_VCO2 = "black"))
spiro_plot(ramp_data,
  style_args = list(axis.title.x = ggplot2::element_text(colour = "green"))
)
更多关于spiro包的语法和可视化案例,感兴趣的同学可阅读spiro包官网[1]
本文参与 腾讯云自媒体同步曝光计划,分享自微信公众号。
原始发表:2024-03-26,如有侵权请联系 cloudcommunity@tencent.com 删除
目录
腾讯云开发者

Copyright © 2013 - 2026 Tencent Cloud. All Rights Reserved. 腾讯云 版权所有
深圳市腾讯计算机系统有限公司 ICP备案/许可证号:粤B2-20090059  粤公网安备44030502008569号
腾讯云计算(北京)有限责任公司 京ICP证150476号 | 京ICP备11018762号