病毒感染相关单细胞文献复现-2


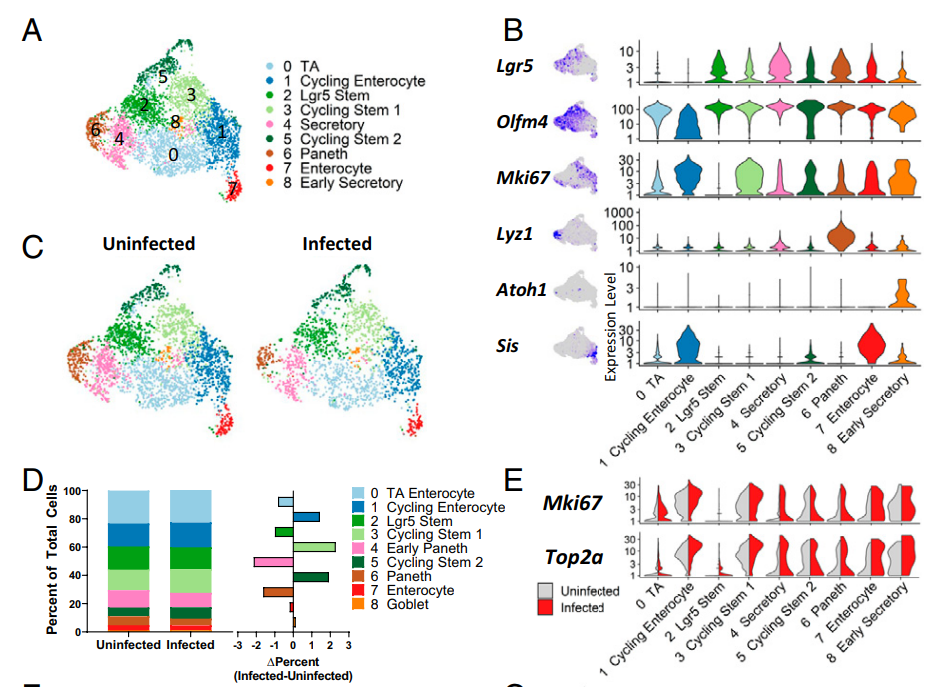
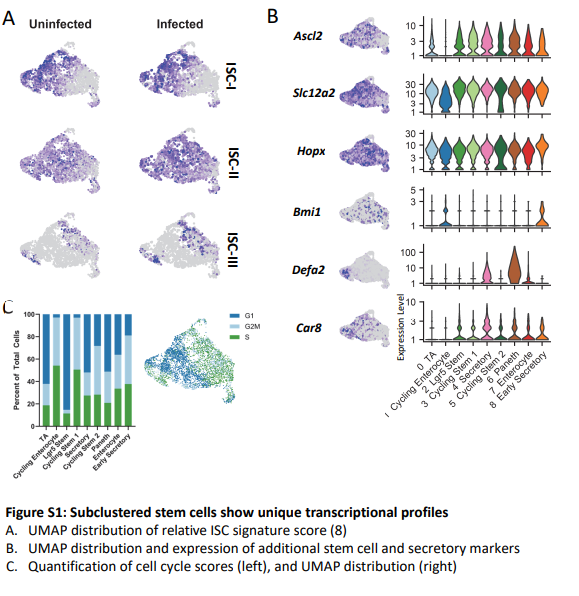
❝接上周复现的单细胞推文,文献中还有亚群细分的数据,所以我这周针对stem cell亚群的细分进行复现,复现只能大致与文章中的数据相似并不能做到完全一致,主要是结合文章中marker gene和人工注释。 ❞
「补充文档」
导入数据
rm(list=ls())
library(Seurat)
library(ggplot2)
library(clustree)
library(cowplot)
library(dplyr)
library(patchwork)
#所用数据为上周推文中输出的文件
sce =readRDS( "../2-harmony/sce.all_int.rds")
sce
sce.stem=sce[,sce$RNA_snn_res.0.1 %in% c(2)]
DimPlot(sce.stem, reduction = "umap",group.by = 'orig.ident', label = T)
getwd()
dir.create('./3-cell/')
setwd('./3-cell/')
sce=sce.stem

sce=CreateSeuratObject(counts = sce@assays$RNA@counts,
                       meta.data = sce@meta.data[,1:9])
sce <- NormalizeData(sce, normalization.method =  "LogNormalize",
                     scale.factor = 1e4)
GetAssay(sce,assay = "RNA")
sce <- FindVariableFeatures(sce,
                            selection.method = "vst", nfeatures = 2000)
sce <- ScaleData(sce)
sce <- RunPCA(object = sce, pc.genes = VariableFeatures(sce))
DimHeatmap(sce, dims = 1:12, cells = 100, balanced = TRUE)
ElbowPlot(sce)

sce <- FindNeighbors(sce, dims = 1:15)
sce <- FindClusters(sce, resolution = 0.1)
table(sce@meta.data$RNA_snn_res.0.1)

set.seed(123)
sce <- RunUMAP(object = sce, dims = 1:15, do.fast = TRUE)
DimPlot(sce,reduction = "umap",label=T)
ggsave(filename = 'before_harmony_umap.pdf')
head(sce@meta.data)
DimPlot(sce,reduction = "umap",label=T,group.by = 'orig.ident')
ggsave(filename = 'before_harmony_umap_orig.ident.pdf')


sce <- FindClusters(sce, resolution = 0.1)
DimPlot(sce,reduction = "umap",label=T)
ggsave(filename = 'before_harmony_umap_recluster_by_0.1.pdf')
DimPlot(sce,reduction = "umap",label=T,
        group.by = 'orig.ident')
ggsave(filename = 'before_harmony_umap_sce_recluster_by_orig.ident.pdf')
harmony
colnames(sce@meta.data)

library(harmony)
seuratObj <- RunHarmony(sce, "orig.ident")
names(seuratObj@reductions)
seuratObj <- RunUMAP(seuratObj,  dims = 1:15,
                     reduction = "harmony")
DimPlot(seuratObj,reduction = "umap",label=T )

sce=seuratObj
sce <- FindNeighbors(sce, reduction = "harmony",
                     dims = 1:15)
#这里选择了分辨率0.2
sce <- FindClusters(sce, resolution = 0.2)
table(sce@meta.data$seurat_clusters)
DimPlot(sce,reduction = "umap",label=T)
ggsave(filename = 'harmony_umap_recluster_by_0.2.pdf',width = 8,height = 8)

sce
save(sce,file = 'first_sce.Rdata')
用文章中提到的marker gene来看细胞亚群分布
load(file = 'first_sce.Rdata')
colnames(sce@meta.data)
sce <- FindClusters(sce, resolution = 0.2)

DimPlot(sce,reduction = "umap",label=T )
ggsave('harmony_umap_recluster_by_0.2.pdf')


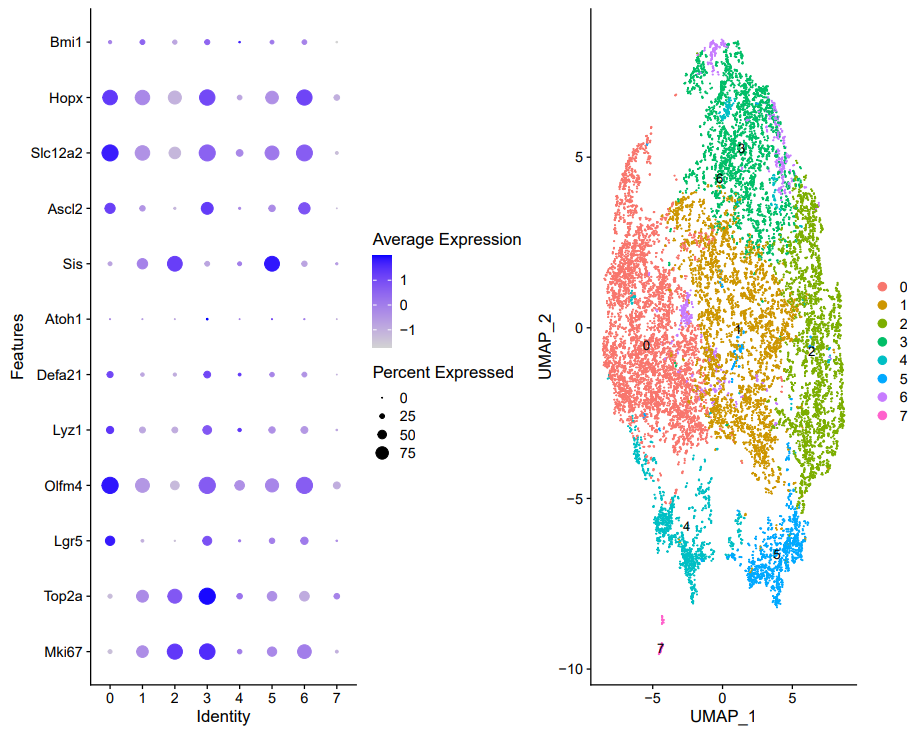
genes_to_check = c('MKI67' ,'TOP2A',"LGR5","OLFM4","MKI67","LYZ1","Defa21",
                   "ATOH1","SIS", "Ascl2", "Slc12a2",
                   "Hopx", "Bmi1")
library(stringr)
genes_to_check=str_to_title(genes_to_check)
genes_to_check
p <- DotPlot(sce, features = unique(genes_to_check),
             assay='RNA'  )  + coord_flip()
p
ggsave(plot=p, filename="./check_RV_marker_by_seurat_cluster.pdf")
p_umap<-DimPlot(sce,reduction = "umap",label=T )
p+p_umap
ggsave('recluster_dotmakers_0.2.pdf')
细胞类型注释 (根据marker gene)
#0:Lgr5 Stem
#1,2:Cycling Enterocyte
#3,4:Cycling Stem
#5:Paneth
#6:Enterocyte
#7:T

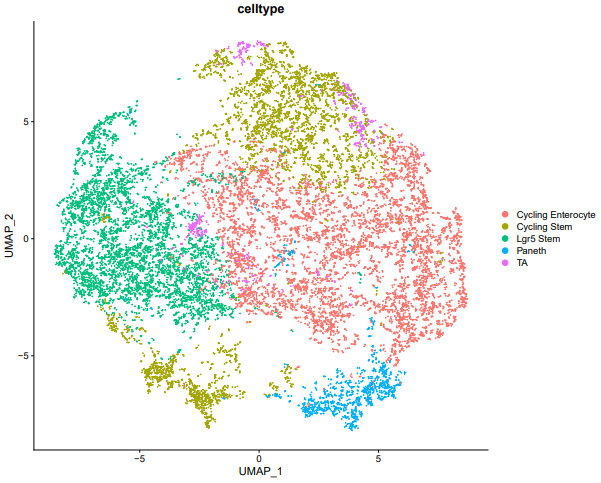
  celltype=data.frame(ClusterID=0:7,
                      celltype=0:7 )
  celltype[celltype$ClusterID %in% c(0),2]='Lgr5 Stem'
  celltype[celltype$ClusterID %in% c(1,2),2]='Cycling Enterocyte'

  celltype[celltype$ClusterID %in% c(3,4),2]='Cycling Stem'
  celltype[celltype$ClusterID %in% c(5),2]='Paneth'

  celltype[celltype$ClusterID %in% c(6),2]='TA'
  celltype[celltype$ClusterID %in% c(7),2]='T'

  head(celltype)
  table(celltype$celltype)

  sce@meta.data$celltype = "NA"
  table(sce@meta.data$RNA_snn_res.0.2 )

  for(i in 1:nrow(celltype)){
    sce@meta.data[which(sce@meta.data$RNA_snn_res.0.2 ==  celltype$ClusterID[i]),'celltype'] <- celltype$celltype[i]}
  table(sce@meta.data$celltype)

  library(stringr)
  p_all_markers <- DotPlot(sce, features = unique(genes_to_check),
                            group.by = "RNA_snn_res.0.2",assay='RNA'  )  + coord_flip()

   p_all_markers
  ggsave(plot=p_all_markers,
         filename="check_all_marker_by_RNA_snn_res.0.2.pdf")

  DimPlot(sce, reduction = "umap",
          group.by = "celltype",label = F)
  ggsave(filename="umap_by_RNA_snn_res.0.1.pdf")

  ######去除干扰细胞亚群T细胞#####
  table(sce$celltype)
  sce <- sce[, !(sce$celltype %in% c('T'  ))]
  DimPlot(sce, reduction = "umap", group.by = "celltype")
  ggsave('RV_umap_by_celltype.pdf')
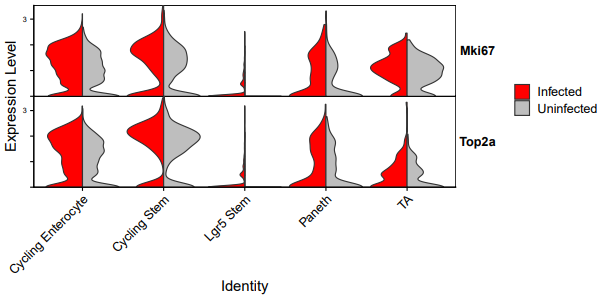
v1<-VlnPlot(sce,features =c("Mki67","Top2a"),group="celltype",
              split.by = "group",flip = T,stack = T,cols = c("red","grey"),
              split.plot =T );v1

  ggsave(plot=v1, filename="volin-2.pdf",width = 8,height = 4)
library(paletteer)
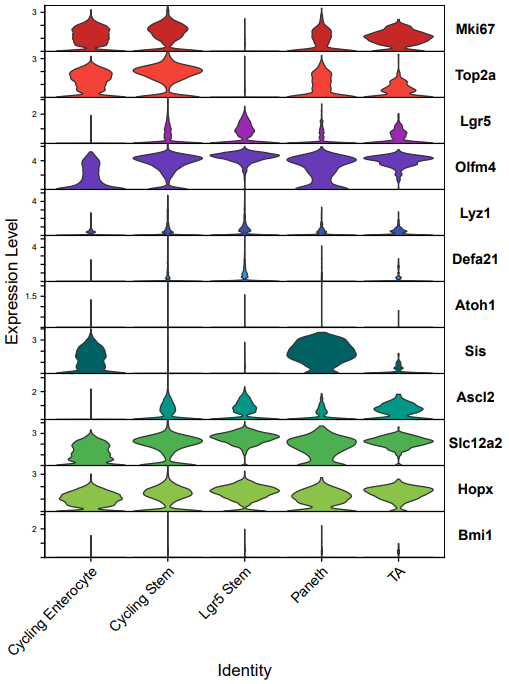
  color <- c(paletteer_d("awtools::bpalette"),
             paletteer_d("awtools::a_palette"),
             paletteer_d("awtools::mpalette"))

  p1 <- VlnPlot(sce,features =  genes_to_check,
                group.by  = "celltype",
                flip = T,stack = T,cols = color
  )
  p2<-p1 + NoLegend()
  ggsave(p2,file="vlnplot1.pdf",height = 8,width=6)
本文参与 腾讯云自媒体同步曝光计划,分享自微信公众号。
原始发表:2023-07-06,如有侵权请联系 cloudcommunity@tencent.com 删除
目录
腾讯云开发者

Copyright © 2013 - 2026 Tencent Cloud. All Rights Reserved. 腾讯云 版权所有
深圳市腾讯计算机系统有限公司 ICP备案/许可证号:粤B2-20090059  粤公网安备44030502008569号
腾讯云计算(北京)有限责任公司 京ICP证150476号 | 京ICP备11018762号