第二课
原创

title: "向量的生成"
output: html_document
date: "2023-04-06"
小白的第二课
c(2,5,6,2,9)## [1] 2 5 6 2 9c("a","f","md","c")## [1] "a" "f" "md" "c"1:5## [1] 1 2 3 4 5rep("x",times=3)## [1] "x" "x" "x"seq(from=3,to=21,by=3)## [1] 3 6 9 12 15 18 21rnorm(n=3)## [1] 0.4295305 -0.9886426 -0.6427203paste0(rep("x",times=3),1:3)## [1] "x1" "x2" "x3"x<-c(1,3,5,1)
x=c(1,3,5,1)
x+1## [1] 2 4 6 2log(x)## [1] 0.000000 1.098612 1.609438 0.000000sqrt(x)## [1] 1.000000 1.732051 2.236068 1.000000x>3## [1] FALSE FALSE TRUE FALSEx==3## [1] FALSE TRUE FALSE FALSEmax(x) #最大值## [1] 5min(x) #最小值## [1] 1mean(x) #均值## [1] 2.5median(x) #中位数## [1] 2var(x) #方差## [1] 3.666667sd(x) #标准差## [1] 1.914854sum(x) #总和## [1] 10length(x) #长度## [1] 4unique(x) #去重复## [1] 1 3 5duplicated(x) #对应元素是否重复## [1] FALSE FALSE FALSE TRUEtable(x) #重复值统计## x
## 1 3 5
## 2 1 1sort(x)## [1] 1 1 3 5sort(x,decreasing = F)## [1] 1 1 3 5sort(x,decreasing = T)## [1] 5 3 1 1x = c(1,3,5,1)
y = c(3,2,5,6)
x == y ## [1] FALSE FALSE TRUE FALSEy == x## [1] FALSE FALSE TRUE FALSEx + y## [1] 4 5 10 7paste(x,y,sep=",")## [1] "1,3" "3,2" "5,5" "1,6"paste(x,y)## [1] "1 3" "3 2" "5 5" "1 6"#当两个向量长度不一致
x = c(1,3,5,6,2)
y = c(3,2,5)
x == y # 啊!warning!## [1] FALSE FALSE TRUE FALSE TRUE#循环补齐--看ppt
a = c(1,2)
b = c(1,2,3)
a+b## [1] 2 4 4a == b## [1] TRUE TRUE FALSE#利用循环补齐简化代码
paste0(rep("x",3),1:3)## [1] "x1" "x2" "x3"paste0("x",1:3)## [1] "x1" "x2" "x3"intersect(x,y)## [1] 3 5 2union(x,y)## [1] 1 3 5 6 2setdiff(x,y)## [1] 1 6setdiff(y,x)## numeric(0)x %in% y #x的每个元素在y中存在吗## [1] FALSE TRUE TRUE FALSE TRUEy %in% x #y的每个元素在x中存在吗## [1] TRUE TRUE TRUEx <- 8:12
#根据逻辑值取子集
x[x == 10]## [1] 10x[x < 12]## [1] 8 9 10 11x[x %in% c(9,13)]## [1] 9#根据位置取子集
x[4]## [1] 11x[2:4]## [1] 9 10 11x[c(1,5)]## [1] 8 12x[-4]## [1] 8 9 10 12x[-(2:4)]## [1] 8 12####2.5.修改向量中的某个/某些元素:取子集+赋值
x## [1] 8 9 10 11 12#改一个元素
x[4] <- 40
x## [1] 8 9 10 40 12#改多个元素
x[c(1,5)] <- c(80,20)
x## [1] 80 9 10 40 20x[x%in%y]## numeric(0)#### 2.6 简单向量作图
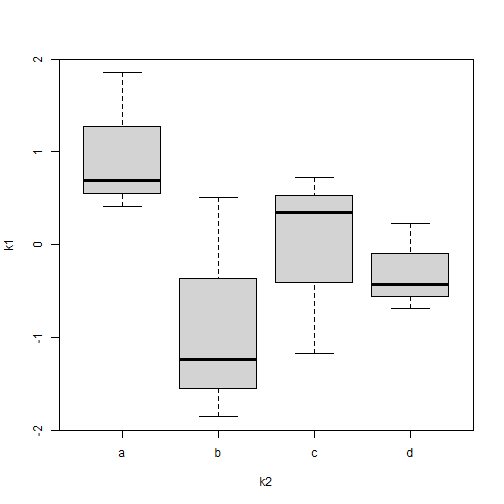
k1 = rnorm(12);k1## [1] 0.4078494 1.8536021 0.6923547 -1.8542915 -1.2391541 0.5122553
## [7] -1.1694122 0.7246900 0.3466781 0.2286454 -0.6850314 -0.4258046k2 = rep(c("a","b","c","d"),each = 3);k2## [1] "a" "a" "a" "b" "b" "b" "c" "c" "c" "d" "d" "d"plot(k1)boxplot(k1~k2)引用自生信技能树 This is an R Markdown document. Markdown is a simple formatting syntax for authoring HTML, PDF, and MS Word documents. For more details on using R Markdown see http://rmarkdown.rstudio.com.
When you click the Knit button a document will be generated that includes both content as well as the output of any embedded R code chunks within the document. You can embed an R code chunk like this:
summary(cars)## speed dist
## Min. : 4.0 Min. : 2.00
## 1st Qu.:12.0 1st Qu.: 26.00
## Median :15.0 Median : 36.00
## Mean :15.4 Mean : 42.98
## 3rd Qu.:19.0 3rd Qu.: 56.00
## Max. :25.0 Max. :120.00Including Plots
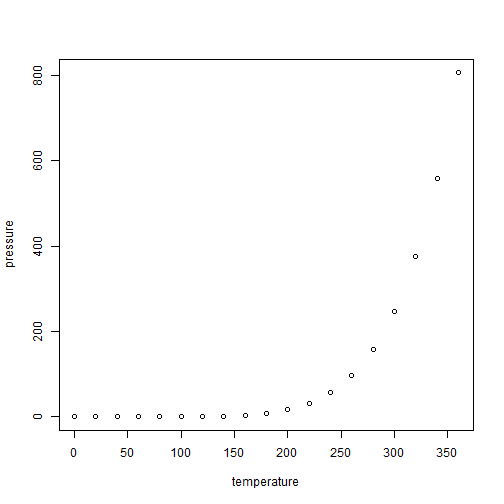
You can also embed plots, for example:
Note that the echo = FALSE parameter was added to the code chunk to prevent printing of the R code that generated the plot.

原创声明:本文系作者授权腾讯云开发者社区发表,未经许可,不得转载。
如有侵权,请联系 cloudcommunity@tencent.com 删除。
原创声明:本文系作者授权腾讯云开发者社区发表,未经许可,不得转载。
如有侵权,请联系 cloudcommunity@tencent.com 删除。
评论
登录后参与评论
推荐阅读
目录
腾讯云开发者

Copyright © 2013 - 2026 Tencent Cloud. All Rights Reserved. 腾讯云 版权所有
深圳市腾讯计算机系统有限公司 ICP备案/许可证号:粤B2-20090059 ![]() 粤公网安备44030502008569号
粤公网安备44030502008569号
腾讯云计算(北京)有限责任公司 京ICP证150476号 | 京ICP备11018762号